
Bayesian NBA Power Rankings
Power rankings with a little more humility

Usually, NBA power rankings go like this: The journalist/reporter finds the logos for 30 teams and puts them in order. The self-important order is proclaimed definitive. The reader finds their team-of-interest’s logo and reads a little blurb. If the team-of-interest is ranked higher than expected, the reader feels good. Otherwise, the reader doesn’t.
Here, we’re taking a more modest approach.
As usual, teams will be ranked. But we’re using our previously discussed team prediction model, which means our rankings come with probability intervals. Your team is ranked 25th? Well maybe (just maybe) there’s a chance they could be ranked 24th.
As always, the model is at the bottom of this post, but at a high level it incorporates factors such as strength of schedule, player injury/illness/protocol, and home court advantage.
Maximum Likelihood Power Rankings
Collapsing our Bayesian model down to a single point estimate for each team, we can recover typical authoritarian power rankings.
Golden State Warriors
Utah Jazz
Cleaveland Cavaliers
Phoenix Suns
Miami Heat
Milwaukee Bucks
Chicago Bulls
Brooklyn Nets
Memphis Grizzlies
Boston Celtics
San Antonio Spurs
Atlanta Hawks
Indiana Pacers
Denver Nuggets
Philadelphia 76ers
Dallas Mavericks
Toronto Raptors
Los Angeles Clippers
Minnesota Timberwolves
Charlotte Hornets
New York Knicks
Washington Wizards
Portland Trail Blazers
Los Angeles Lakers
Sacramento Kings
New Orleans Pelicans
Houston Rockets
Oklahoma City Thunder
Orlando Magic
Detroit Pistons
Posterior Sample Power Rankings
Since we have a fully Bayesian model, we can sample from the posterior of our power rankings thousands of times, and look at any individual sample. Here’s a random sample:
Utah Jazz
Phoenix Suns
Golden State Warriors
Miami Heat
Memphis Grizzlies
Cleveland Cavaliers
Dallas Mavericks
New York Knicks
Los Angeles Clippers
Brooklyn Nets
Chicago Bulls
San Antonio Spurs
Sacramento Kings
Washington Wizards
Milwaukee Bucks
Denver Nuggets
Toronto Raptors
Portland Trail Blazers
Philadelphia 76ers
Minnesota Timberwolves
Atlanta Hawks
Los Angeles Lakers
Oklahoma City Thunder
Boston Celtics
Charlotte Hornets
New Orleans Pelicans
Houston Rockets
Indiana Pacers
Orlando Magic
Detroit Pistons
So what’s different between this and our maximum likelihood power rankings? For example, in this sample, Utah is ranked ahead of Golden State. Our model thinks this is feasible. Meaning, if you were originally upset that Utah was ranked so low, rest assured our model gives them some breathing room. Also, Bucks fans much prefer the maximum likelihood rankings over rolling the dice.
Posterior Distribution Power Rankings
Let’s get the fully Bayesian model: the entire distribution from our power rankings. Here we can get a sense of not only where each team ranks, but how certain the model is in the ranking. I’ll save you the team logo and generic blurb that typically accompanies each team’s power rank.
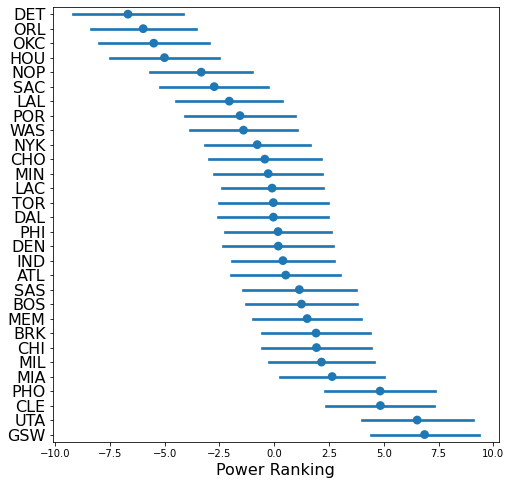
Let’s break down a few key takeaways:
The middle tier is really clogged. Teams ranked 5 through 25 are all similarly matched (with large uncertainty). The model essentially can’t tell the difference between any of the teams in this tier.
The top 2, Utah and Golden State (with reasonable certainty) are running away with it.
As the season progresses, the uncertainty in our power rankings will get smaller. We’ll provide periodic updates.
Look at the error bars to get a sense of how authoritarian we can be. Atlanta is ranked higher than Denver, but not really. Typical power rankings would state Atlanta > Denver, but our error bars say it could really go either way.
Under the hood, our model breaks down defensive and offensive power rankings.
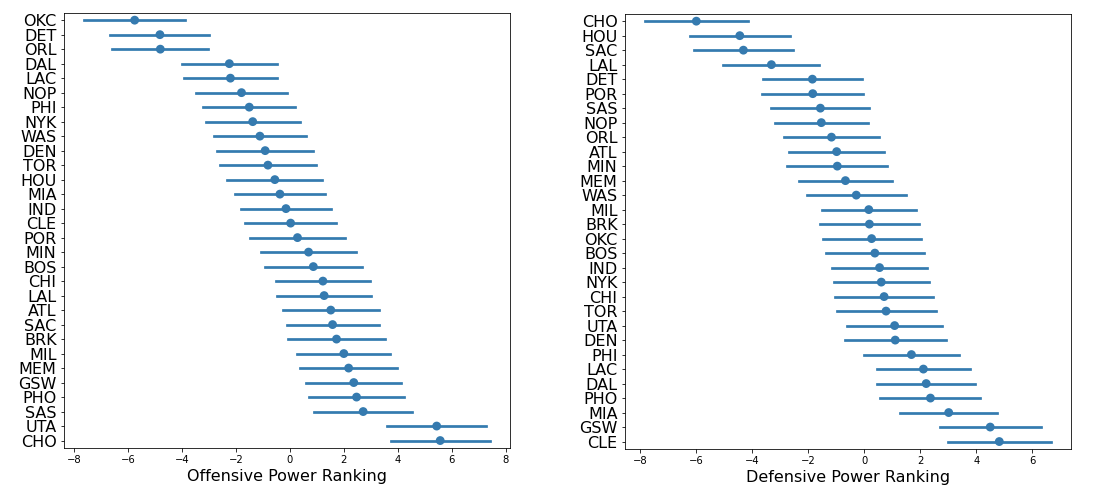
Stare at those plots for a minute and soak in how breathtaking the Hornets are.
Some key take-aways:
There’s more variance in offensive team strength than defensive team strength. This has been documented exhaustively.
Utah and Charlotte are really ahead of the pack offensively.
Again, look at the intervals to get a sense of certainty: Maybe Golden State is better than Cleveland defensively, maybe not. They’re definitely better than the Lakers though.
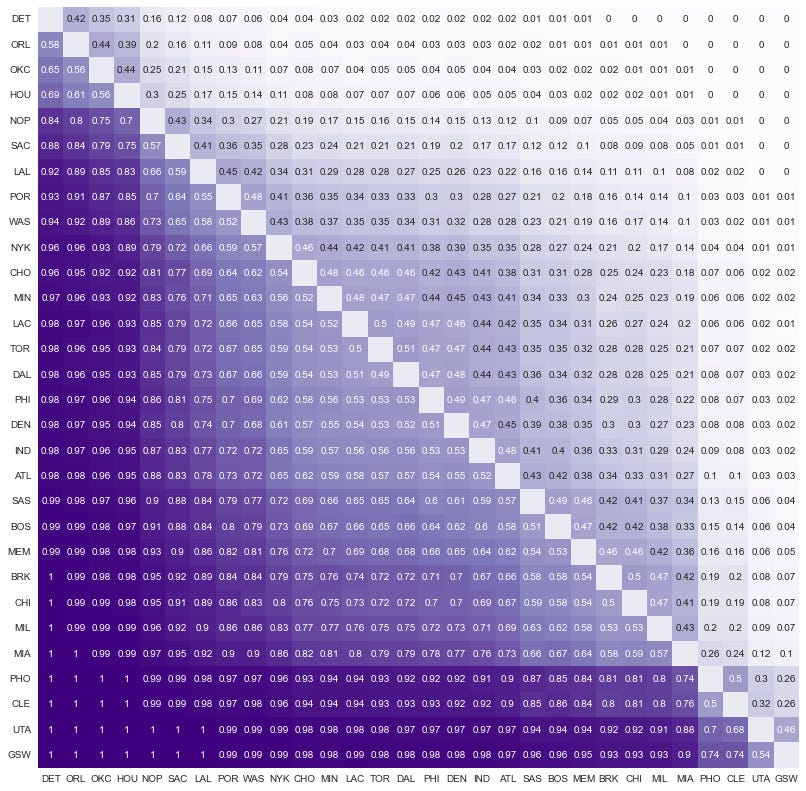
Since we lack the typical authority that comes with point-estimate power rankings, we can play some fun games with our power rankings. We can ask probabilistic questions like:
What’s the chance Cleveland is actually ranked #1?
What’s the chance the Knicks are ranked higher than the Nets?
How likely is it that Toronto is the best team in the east?
Basically any question about the certainty in our rankings can be inspected.
Rather than tackle any individual question, we’re going to try to tackle them all at once. You read the following plot as: The probability the team on the Y axis is better than the team on the X axis is the value in the square. Golden State has a 74% chance of being better than the Cavaliers and a 54% chance of being better than the Jazz.
Looking ahead
I’m having a lot of fun with these models. As you can hopefully see, this post was a more light-hearted take on our typical Bayesian models. So, what’s coming next? I don’t know. I have a few half finished posts, a few half finished models, and lots of ideas.
Stan Model
This model is a beast. Reach out if you have any questions, which if you read through it, I’m sure you have plenty.
// Omnibus model, iteratively throwing in the kitchen sink

data {

    //----------------------------------------//
    // Historical game data                   //
    //----------------------------------------//

    int<lower=0> n_games;                // Number of games
    int<lower=0> n_teams;                // Number of teams
    int<lower=0>away_teams[n_games];     // Away team for each game
    int<lower=0>home_teams[n_games];     // Home team for each game
    real<lower=0>away_score[n_games];     // Away score for each game
    real<lower=0>home_score[n_games];     // Home score for each game
    real home_offensive_inactive[n_games];     // Home offensive inactive score for each game
    real home_defensive_inactive[n_games];     // Home defensive inactive score for each game
    real away_offensive_inactive[n_games];     // Away offensive inactive score for each game
    real away_defensive_inactive[n_games];     // Away defensive inactive score for each game

    //----------------------------------------//
    // Data only used to generate predictions //
    //----------------------------------------//

    int n_games_prediction;                // Number of games
    // Scores for players confirmed out
    real home_offensive_inactive_prediction[n_games_prediction];
    real home_defensive_inactive_prediction[n_games_prediction];
    real away_offensive_inactive_prediction[n_games_prediction];
    real away_defensive_inactive_prediction[n_games_prediction];
    // Scores for players confirmed out and Day-by-day
    real home_offensive_inactive_prediction_questionable[n_games_prediction];
    real home_defensive_inactive_prediction_questionable[n_games_prediction];
    real away_offensive_inactive_prediction_questionable[n_games_prediction];
    real away_defensive_inactive_prediction_questionable[n_games_prediction];
}
parameters {

    //----------------------------------------//
    // Team performance parameters            //
    //----------------------------------------//
    real home_advantage;                 // Home team advantage
    real<lower=0> sigma;                 // Model error
    real<lower=0> alpha;                 // Model intercept

    vector[n_teams] team_offense;        // Team Offense
    real<lower=0> team_offense_sigma_bar;      // Pooled team offense
    vector[n_teams] team_defense;        // Team Defense
    real<lower=0> team_defense_sigma_bar;      // Pooled team defense


    //----------------------------------------//
    // Inactice Player parameters             //
    //----------------------------------------//
    real beta_offensive_inactive;
    real beta_defensive_inactive;
}


model {
    //----------------------------------------//
    // Priors                                 //
    //----------------------------------------//
    team_offense_sigma_bar ~ cauchy(0, 5);
    team_offense ~ normal(0, team_offense_sigma_bar);
    team_defense_sigma_bar ~ cauchy(0, 5);
    team_defense ~ normal(0, team_defense_sigma_bar);
    sigma ~ cauchy(0, 5);
    alpha ~ normal(100, 5);
    home_advantage ~ normal(0, 5);
    beta_offensive_inactive ~ normal(0, 5);
    beta_defensive_inactive ~ normal(0, 5);

    //----------------------------------------//
    // Model                                  //
    //----------------------------------------//

    for(game in 1:n_games) {
        home_score[game] ~ normal(alpha +
                                  home_advantage +
                                  beta_offensive_inactive * home_offensive_inactive[game] +
                                  beta_defensive_inactive * away_defensive_inactive[game] +
                                  team_offense[home_teams[game]] -
                                  team_defense[away_teams[game]],
                                  sigma);
        away_score[game] ~ normal(alpha +
                                  beta_offensive_inactive * away_offensive_inactive[game] +
                                  beta_defensive_inactive * home_defensive_inactive[game] +
                                  team_offense[away_teams[game]] -
                                  team_defense[home_teams[game]],
                                   sigma);
    }

}

generated quantities {
    vector[n_games_prediction] home_predictions;
    vector[n_games_prediction] away_predictions;
    vector[n_games_prediction] total_score_predictions;
    vector[n_games_prediction] home_team_diff_predictions;

    for(game in 1:n_games_prediction) {
        home_predictions[game] = normal_rng(alpha +
                                  home_advantage +
                                  beta_offensive_inactive * home_offensive_inactive_prediction[game] +
                                  beta_defensive_inactive * away_defensive_inactive_prediction[game] +
                                  team_offense[home_teams[game]] -
                                  team_defense[away_teams[game]],
                                  sigma);
        away_predictions[game] = normal_rng(alpha +
                                  beta_offensive_inactive * away_offensive_inactive_prediction[game] +
                                  beta_defensive_inactive * home_defensive_inactive_prediction[game] +
                                  team_offense[away_teams[game]] -
                                  team_defense[home_teams[game]],
                                   sigma);
        total_score_predictions[game] = home_predictions[game] + away_predictions[game];
        home_team_diff_predictions[game] = home_predictions[game] - away_predictions[game];
    }

    // Repeat above but consider 'day-by-day' players to be out for the game
    vector[n_games_prediction] home_predictions_questionable;
    vector[n_games_prediction] away_predictions_questionable;
    vector[n_games_prediction] total_score_predictions_questionable;
    vector[n_games_prediction] home_team_diff_predictions_questionable;

    for(game in 1:n_games_prediction) {
        home_predictions_questionable[game] = normal_rng(alpha +
                                  home_advantage +
                                  beta_offensive_inactive * home_offensive_inactive_prediction_questionable[game] +
                                  beta_defensive_inactive * away_defensive_inactive_prediction_questionable[game] +
                                  team_offense[home_teams[game]] -
                                  team_defense[away_teams[game]],
                                  sigma);
        away_predictions[game] = normal_rng(alpha +
                                  beta_offensive_inactive * away_offensive_inactive_prediction_questionable[game] +
                                  beta_defensive_inactive * home_defensive_inactive_prediction_questionable[game] +
                                  team_offense[away_teams[game]] -
                                  team_defense[home_teams[game]],
                                   sigma);
        total_score_predictions_questionable[game] = home_predictions_questionable[game] + away_predictions_questionable[game];
        home_team_diff_predictions_questionable[game] = home_predictions_questionable[game] - away_predictions_questionable[game];
    }
}
This is very interesting work. Thanks! A little quibble regarding legibility, could you add some horizontal lines or shading to the power ranking plots? It's almost impossible to be sure I'm seeing the correct interval for the team on the y-axis.
Also, would it be possible to color code in some of the statistical significance. If the model can't statistically tell the difference for ranks 5 to 25 they could be one color, different from the top 2, or 4 depending on significance at some confidence level.
this whole substack has been quite an inspiration. any chance you're still around doing this stuff? would love to see more from you and/or ask questions!