
Chris Paul's Legendary Playmaking Career
Bayesian hierarchical modeling of playmaking highlights how consistently Chris Paul stands out as a playmaker

In our previous post, we developed a Bayesian Hierarchical model for playmaking in the NBA.

The full Stan model is at the bottom, but briefly, we learn a latent playmaking variable for each player that predicts their downstream playmaking stats (e.g. assists, secondary assists, etc.)
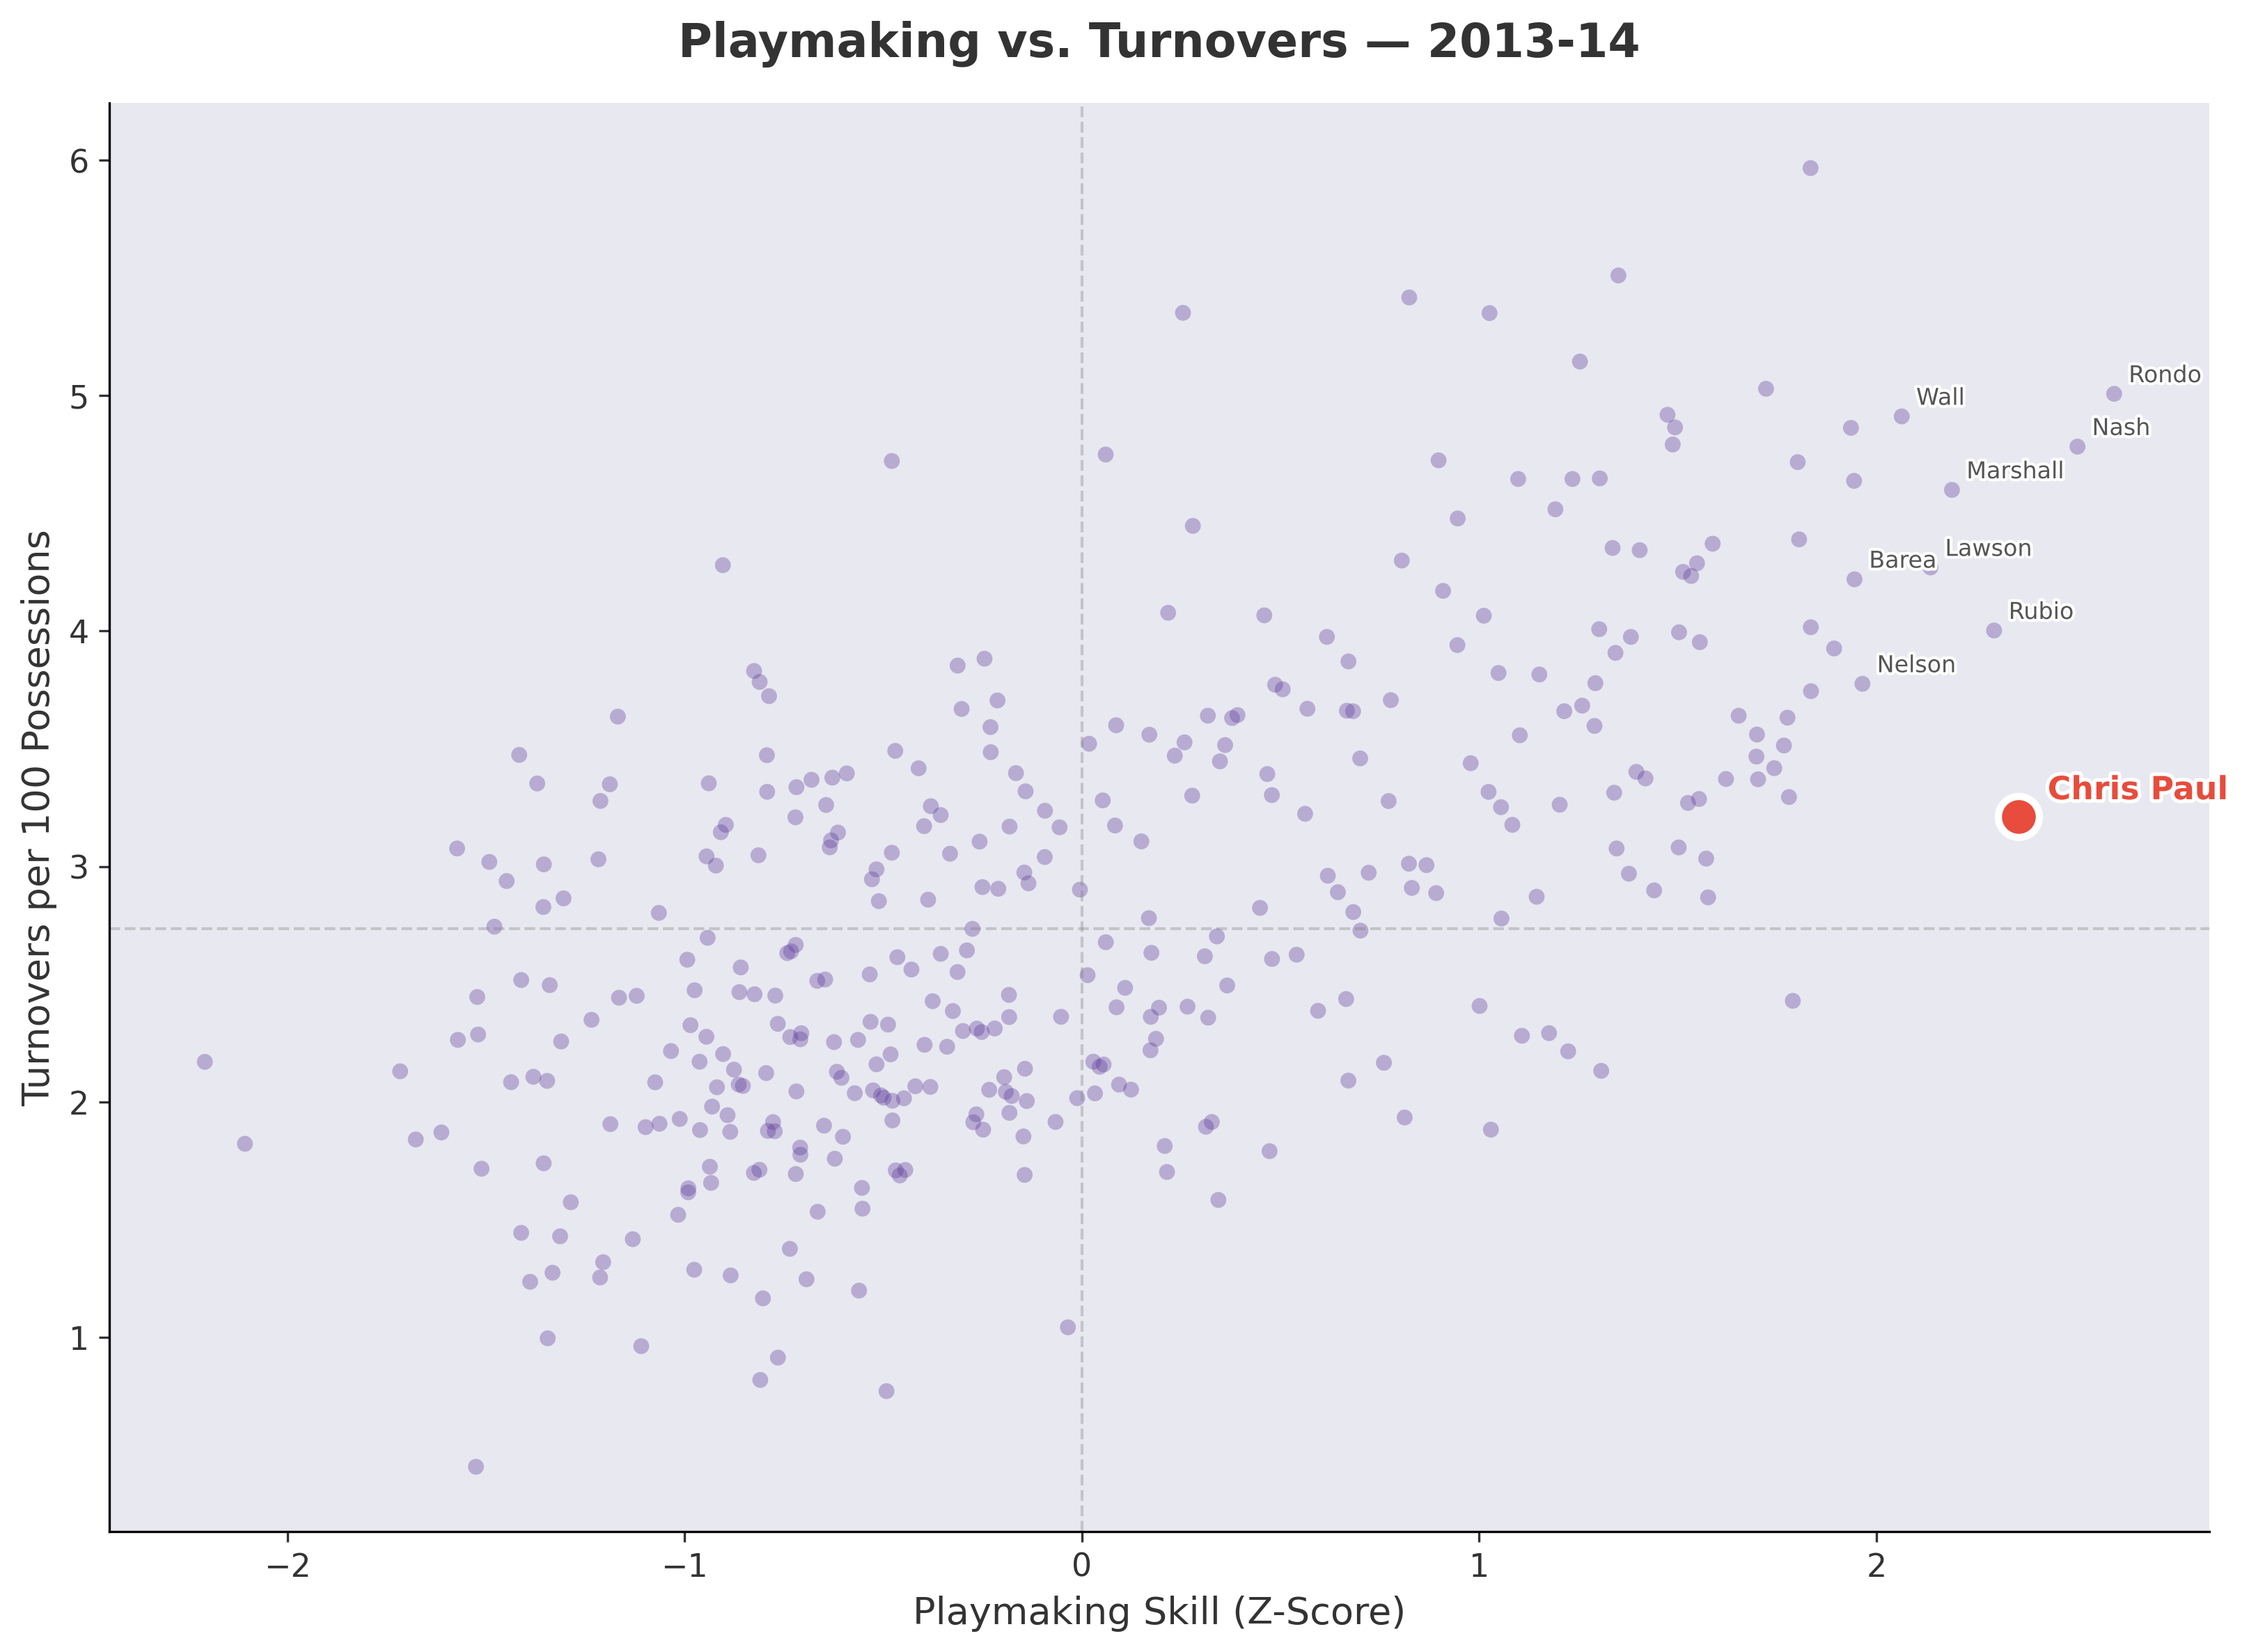
Importantly, we saw (unsurprisingly) that increased playmaking is correlated with increased turnovers. Chris Paul was noted as an outlier with high Bayesian playmaking ability, but low empirical turnover rate.
Chris Paul’s Playmaking Through the Years
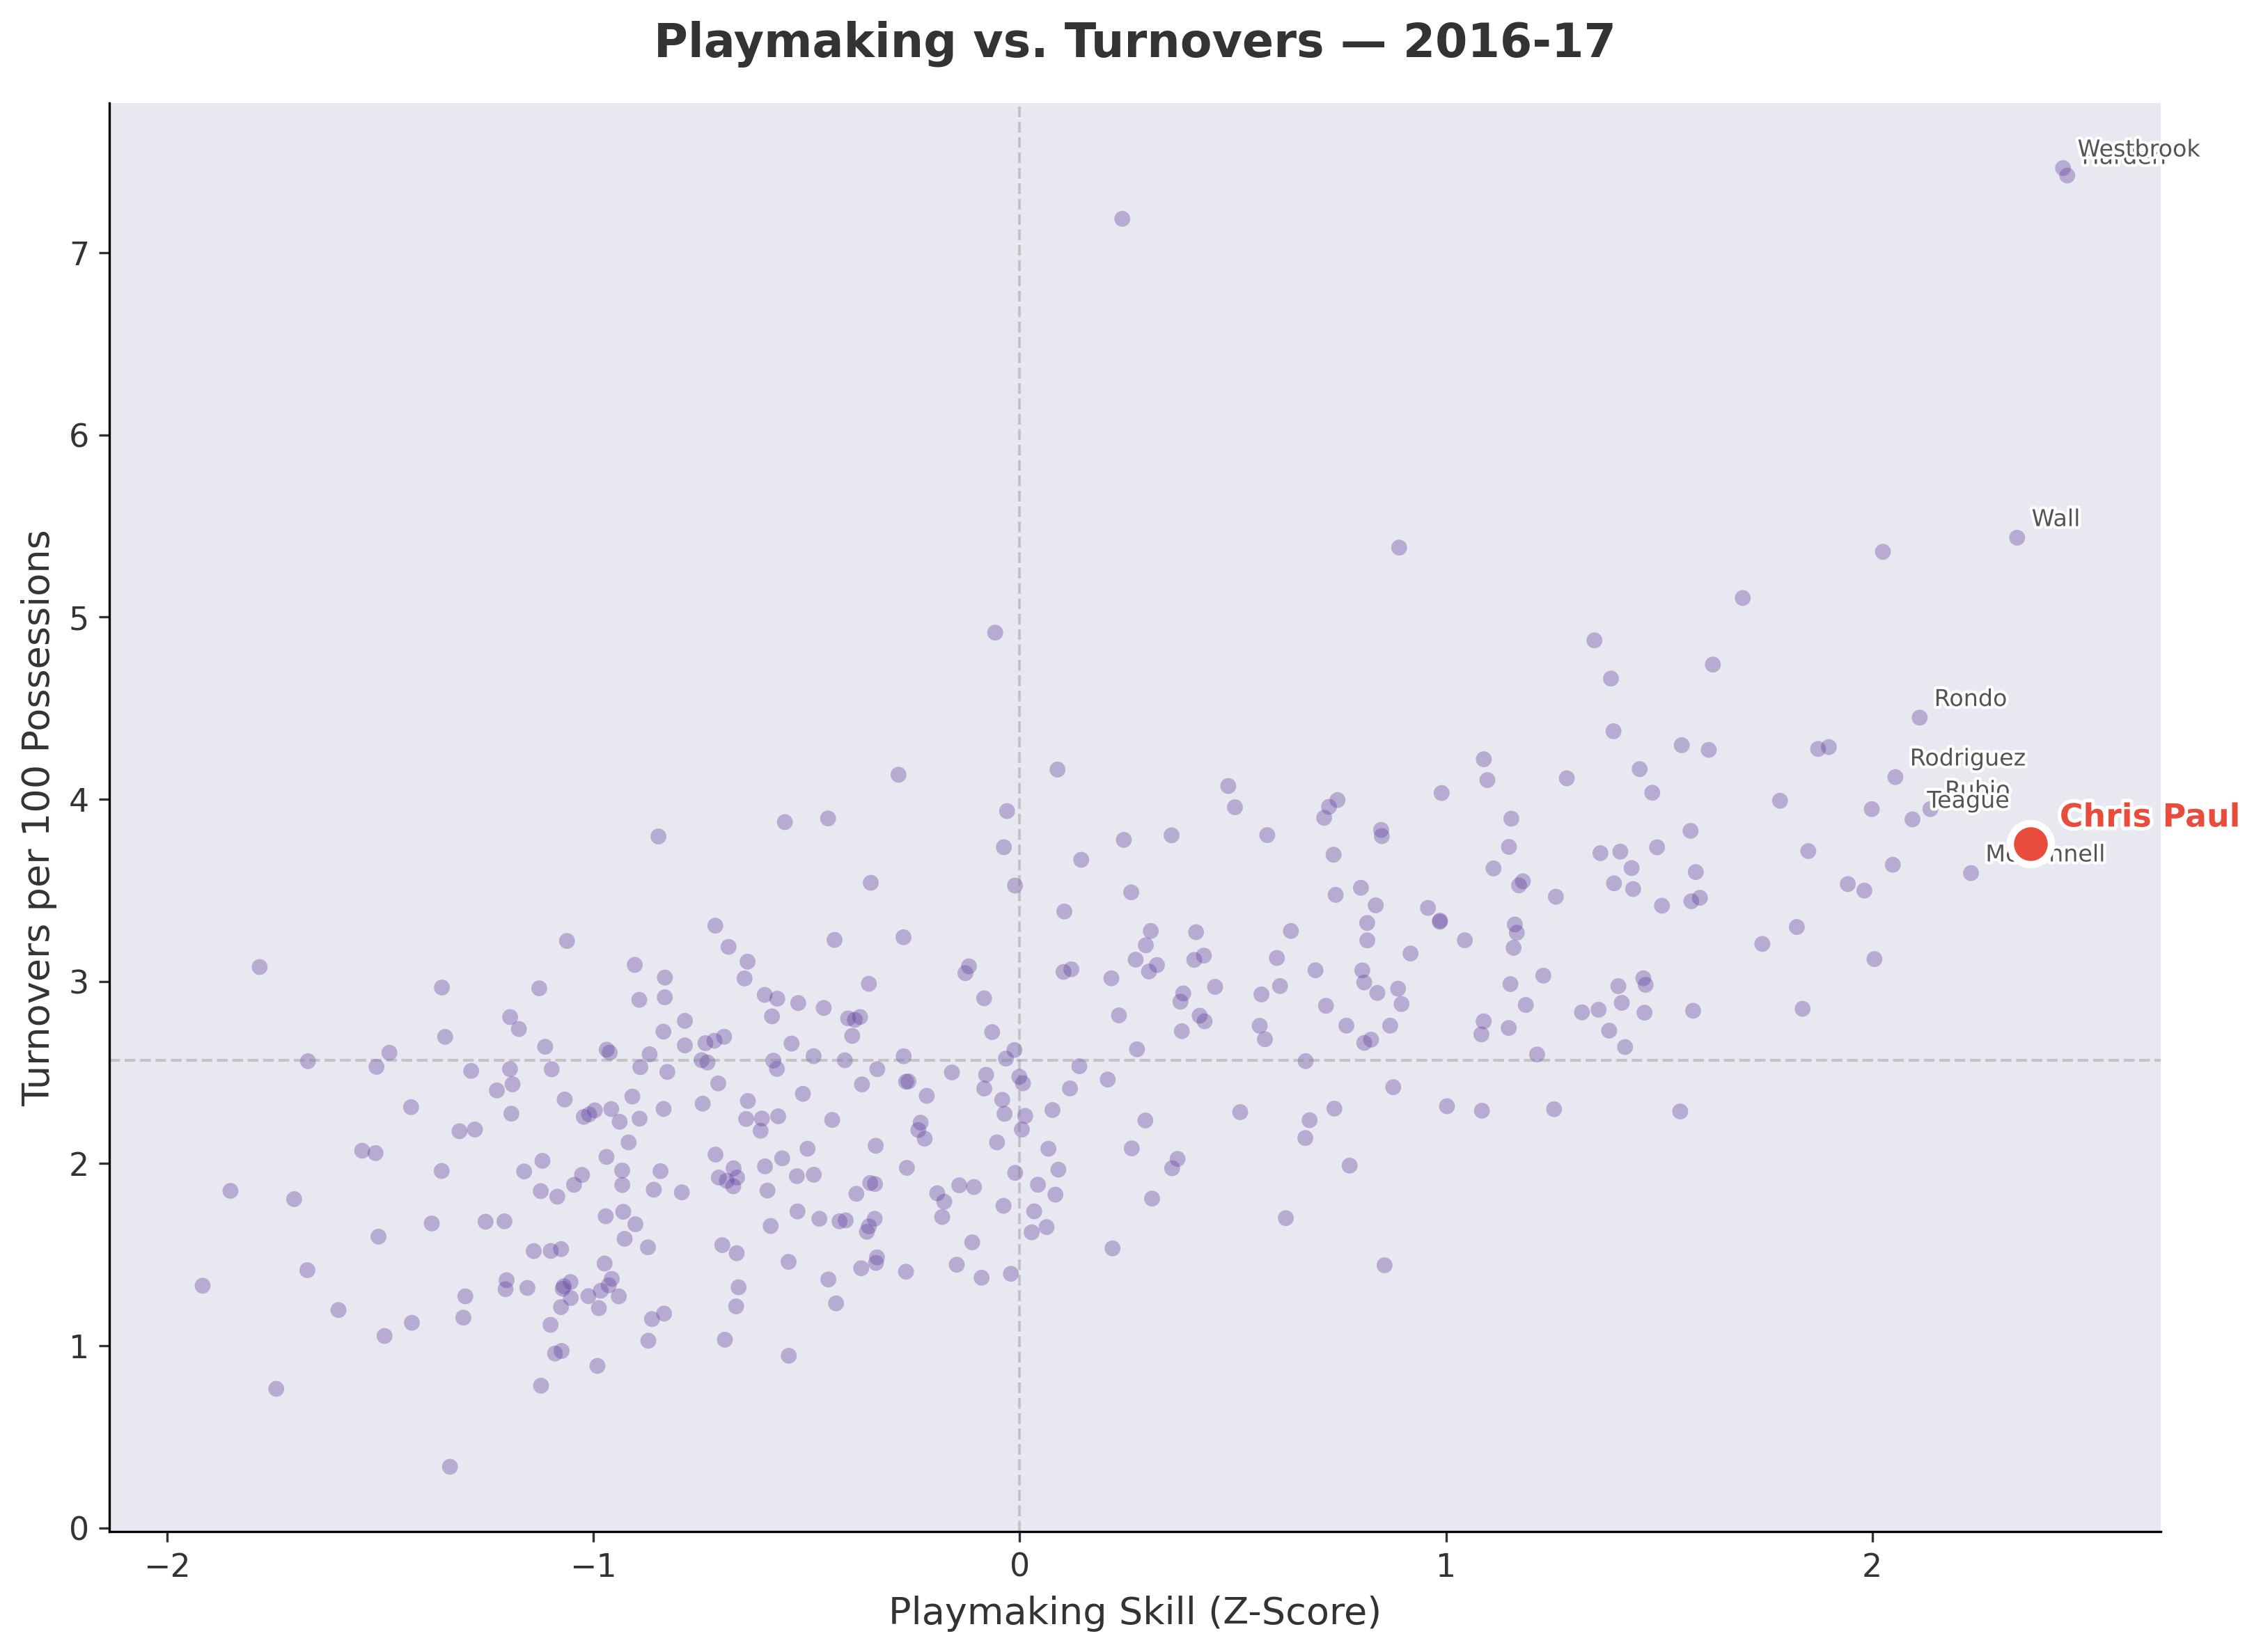
Here is Chris Paul’s 2013-14 season. Notice how he is near the top in playmaking (far right on the x-axis), but a clear outlier, with a low turnover rate (low on the y-axis)
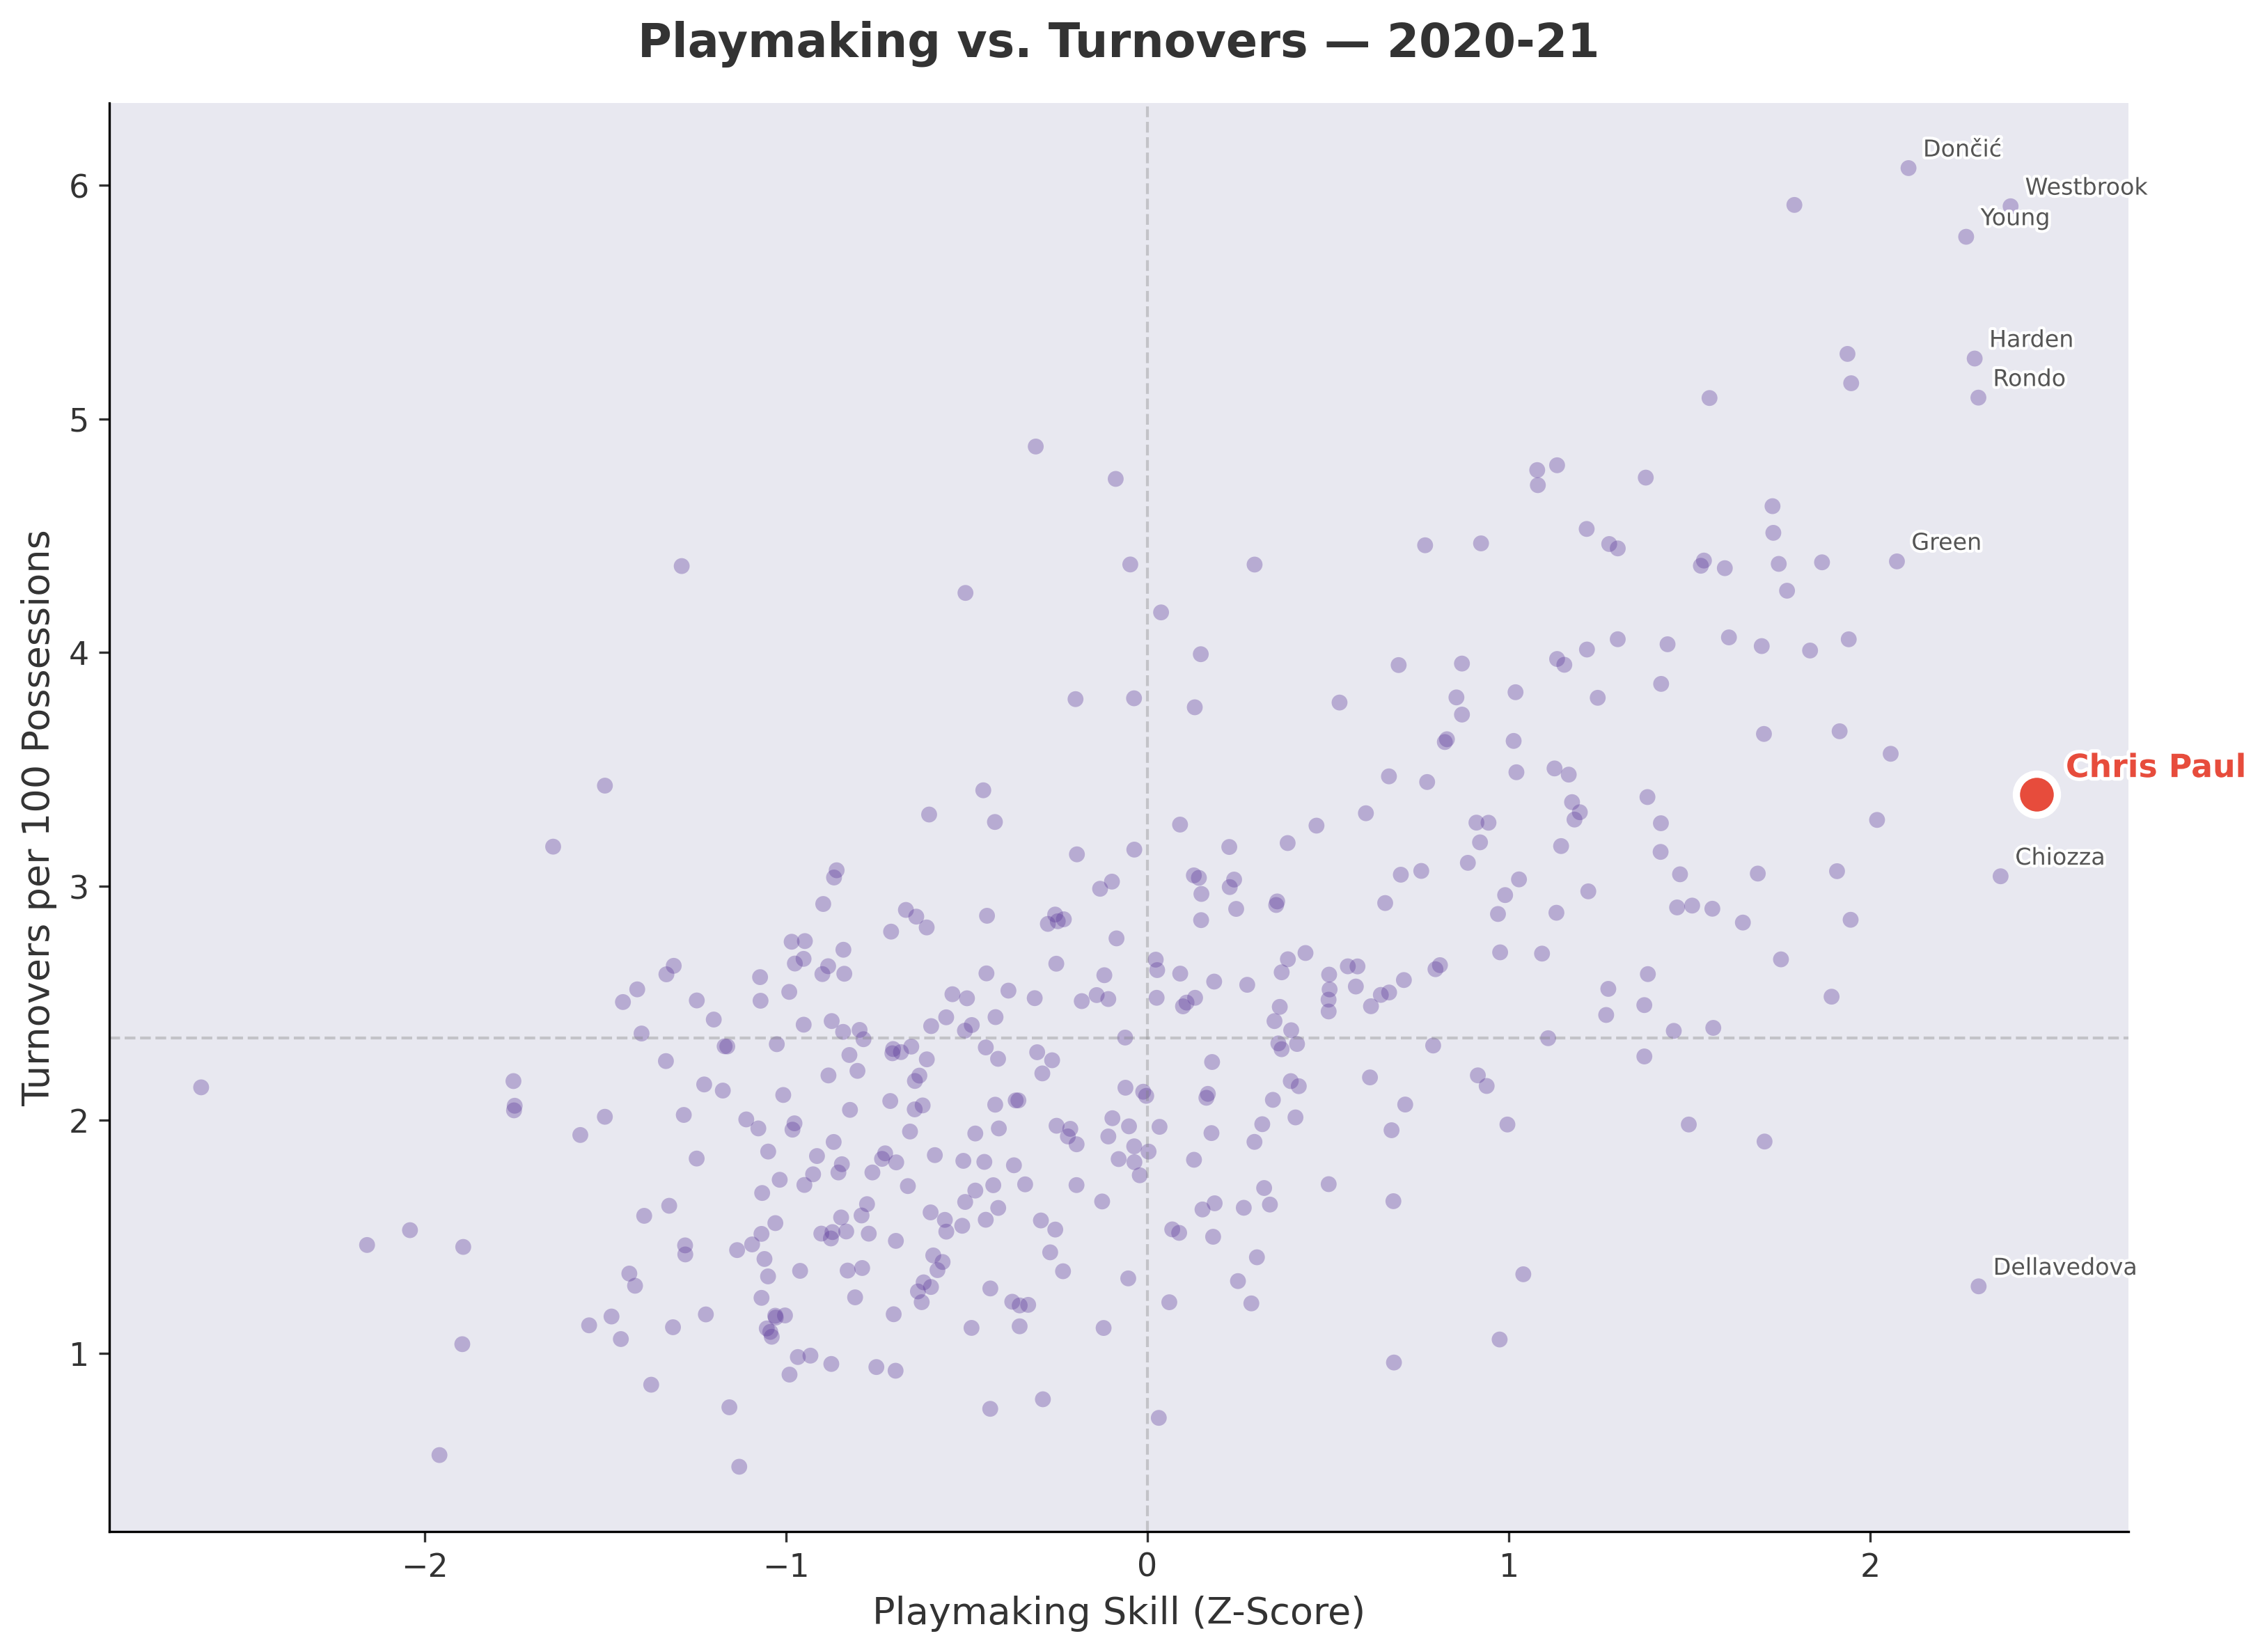
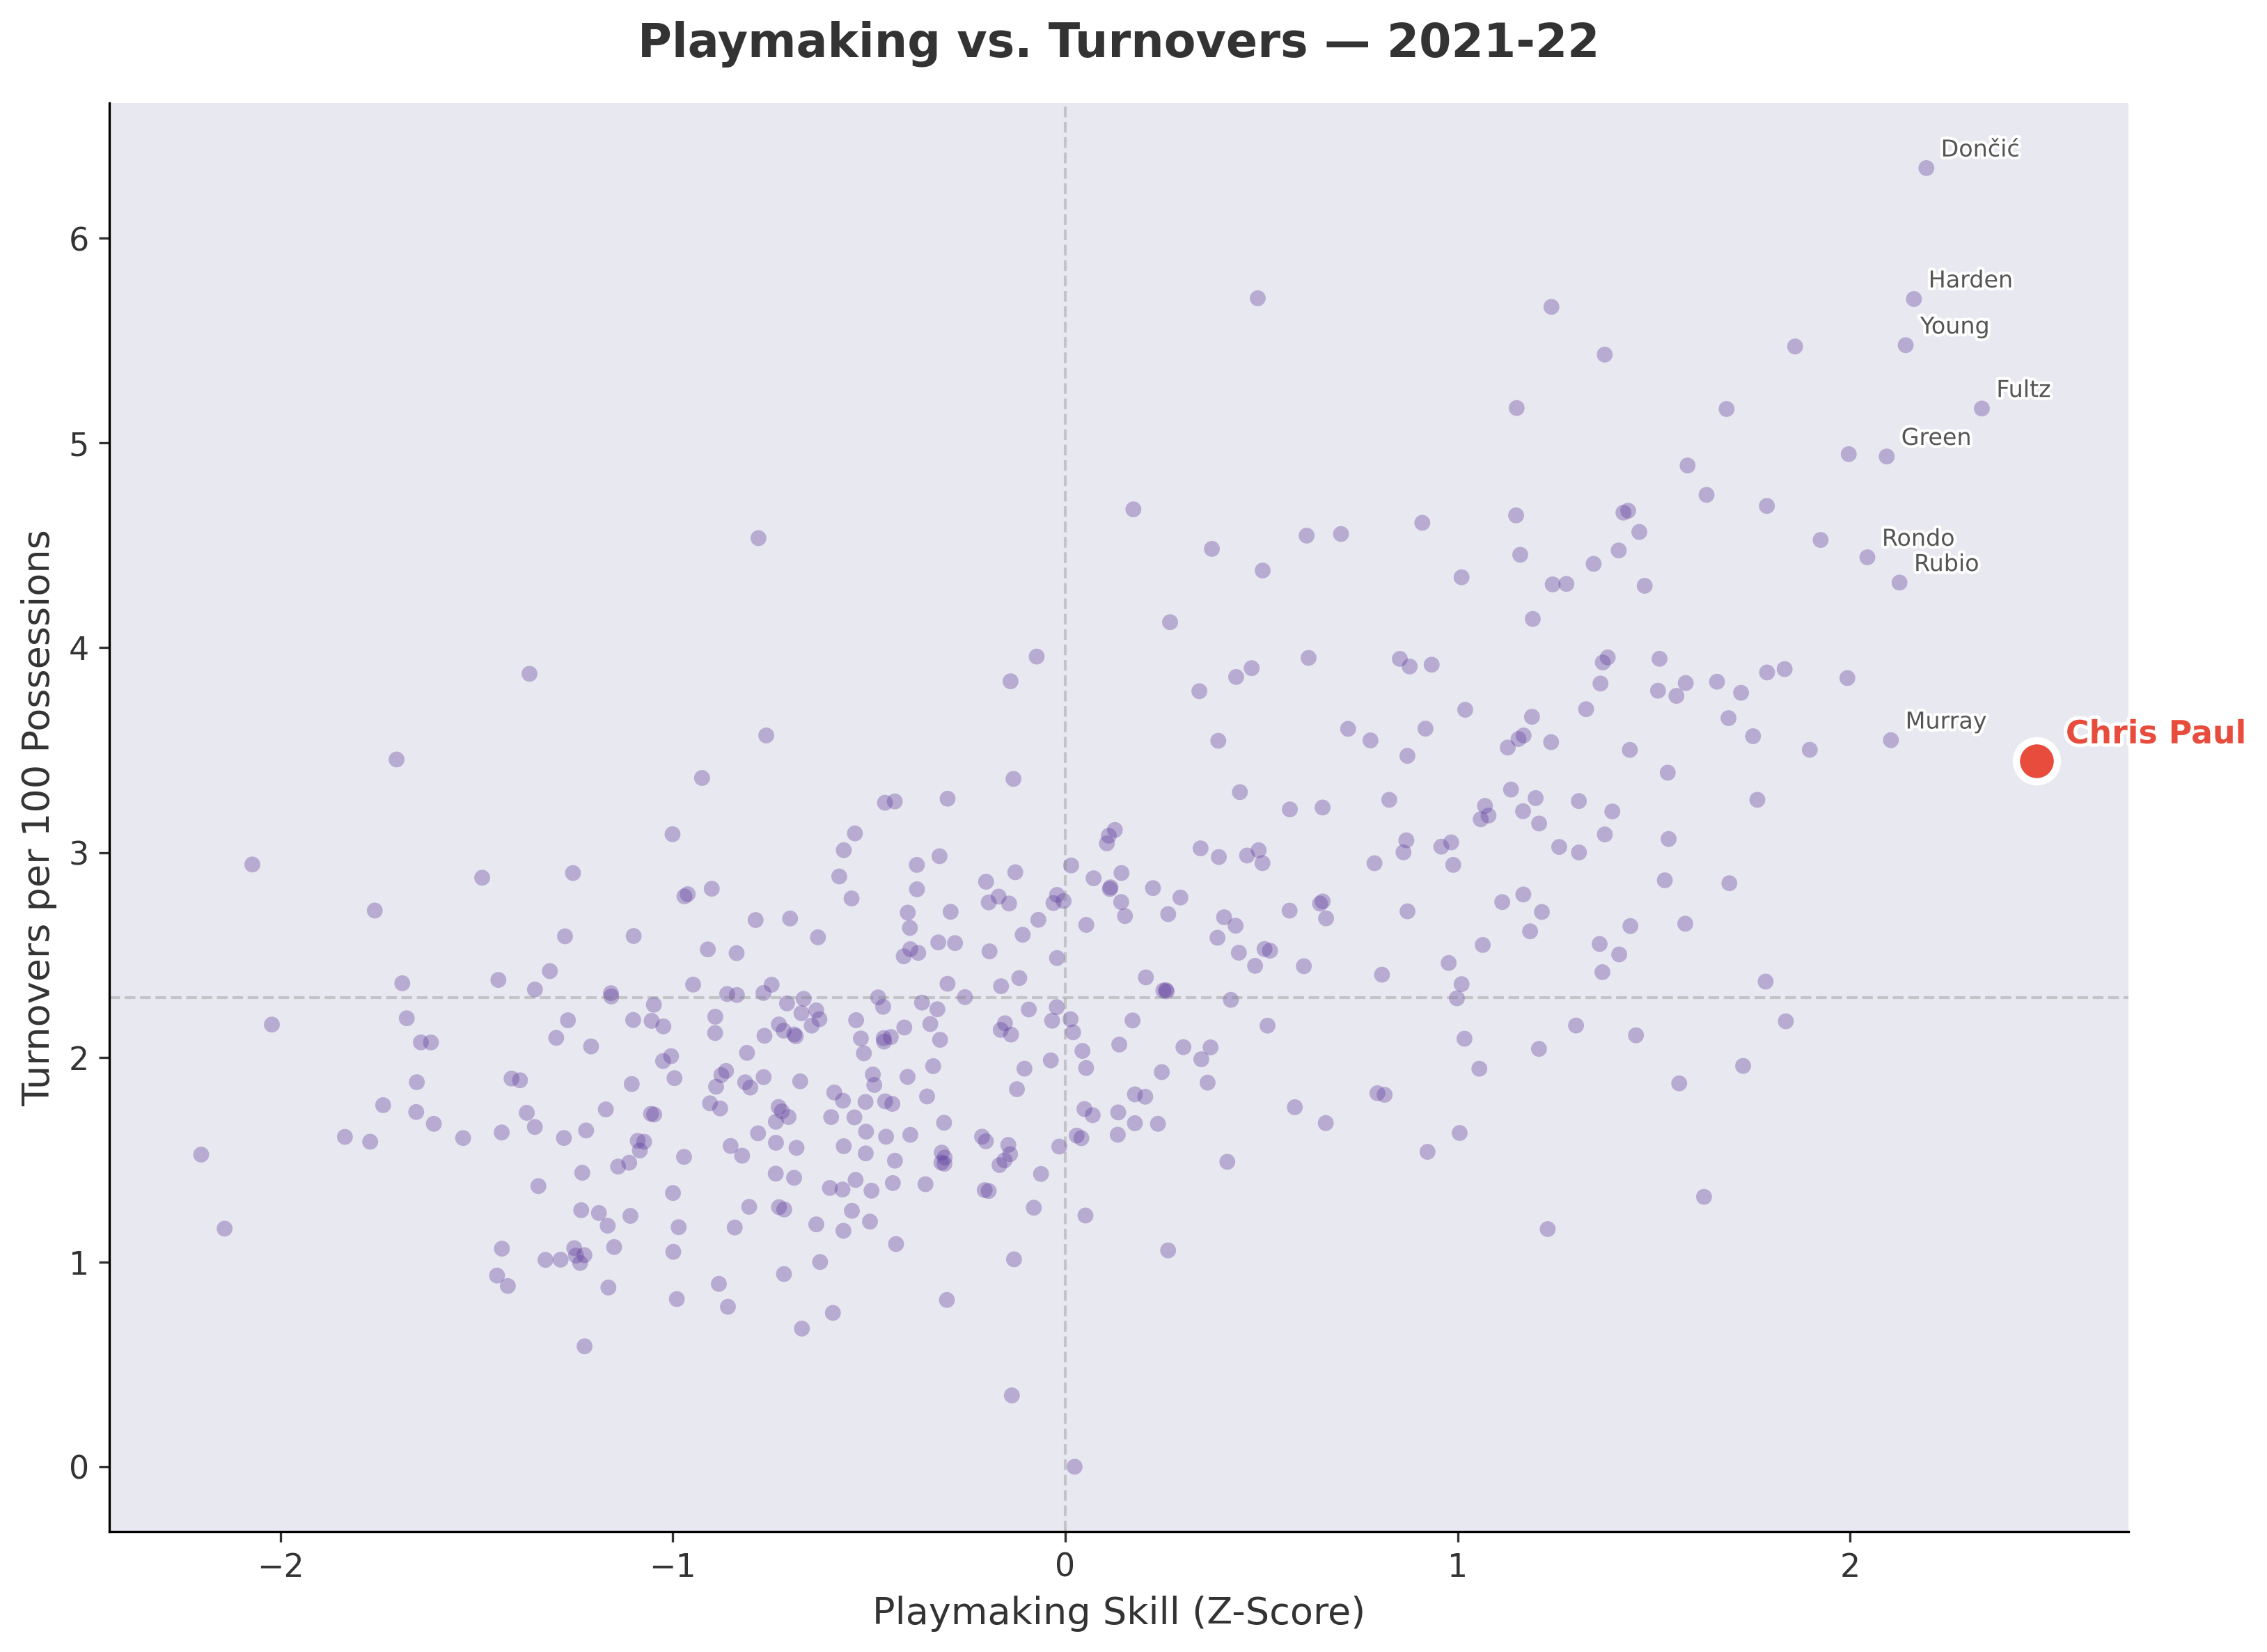
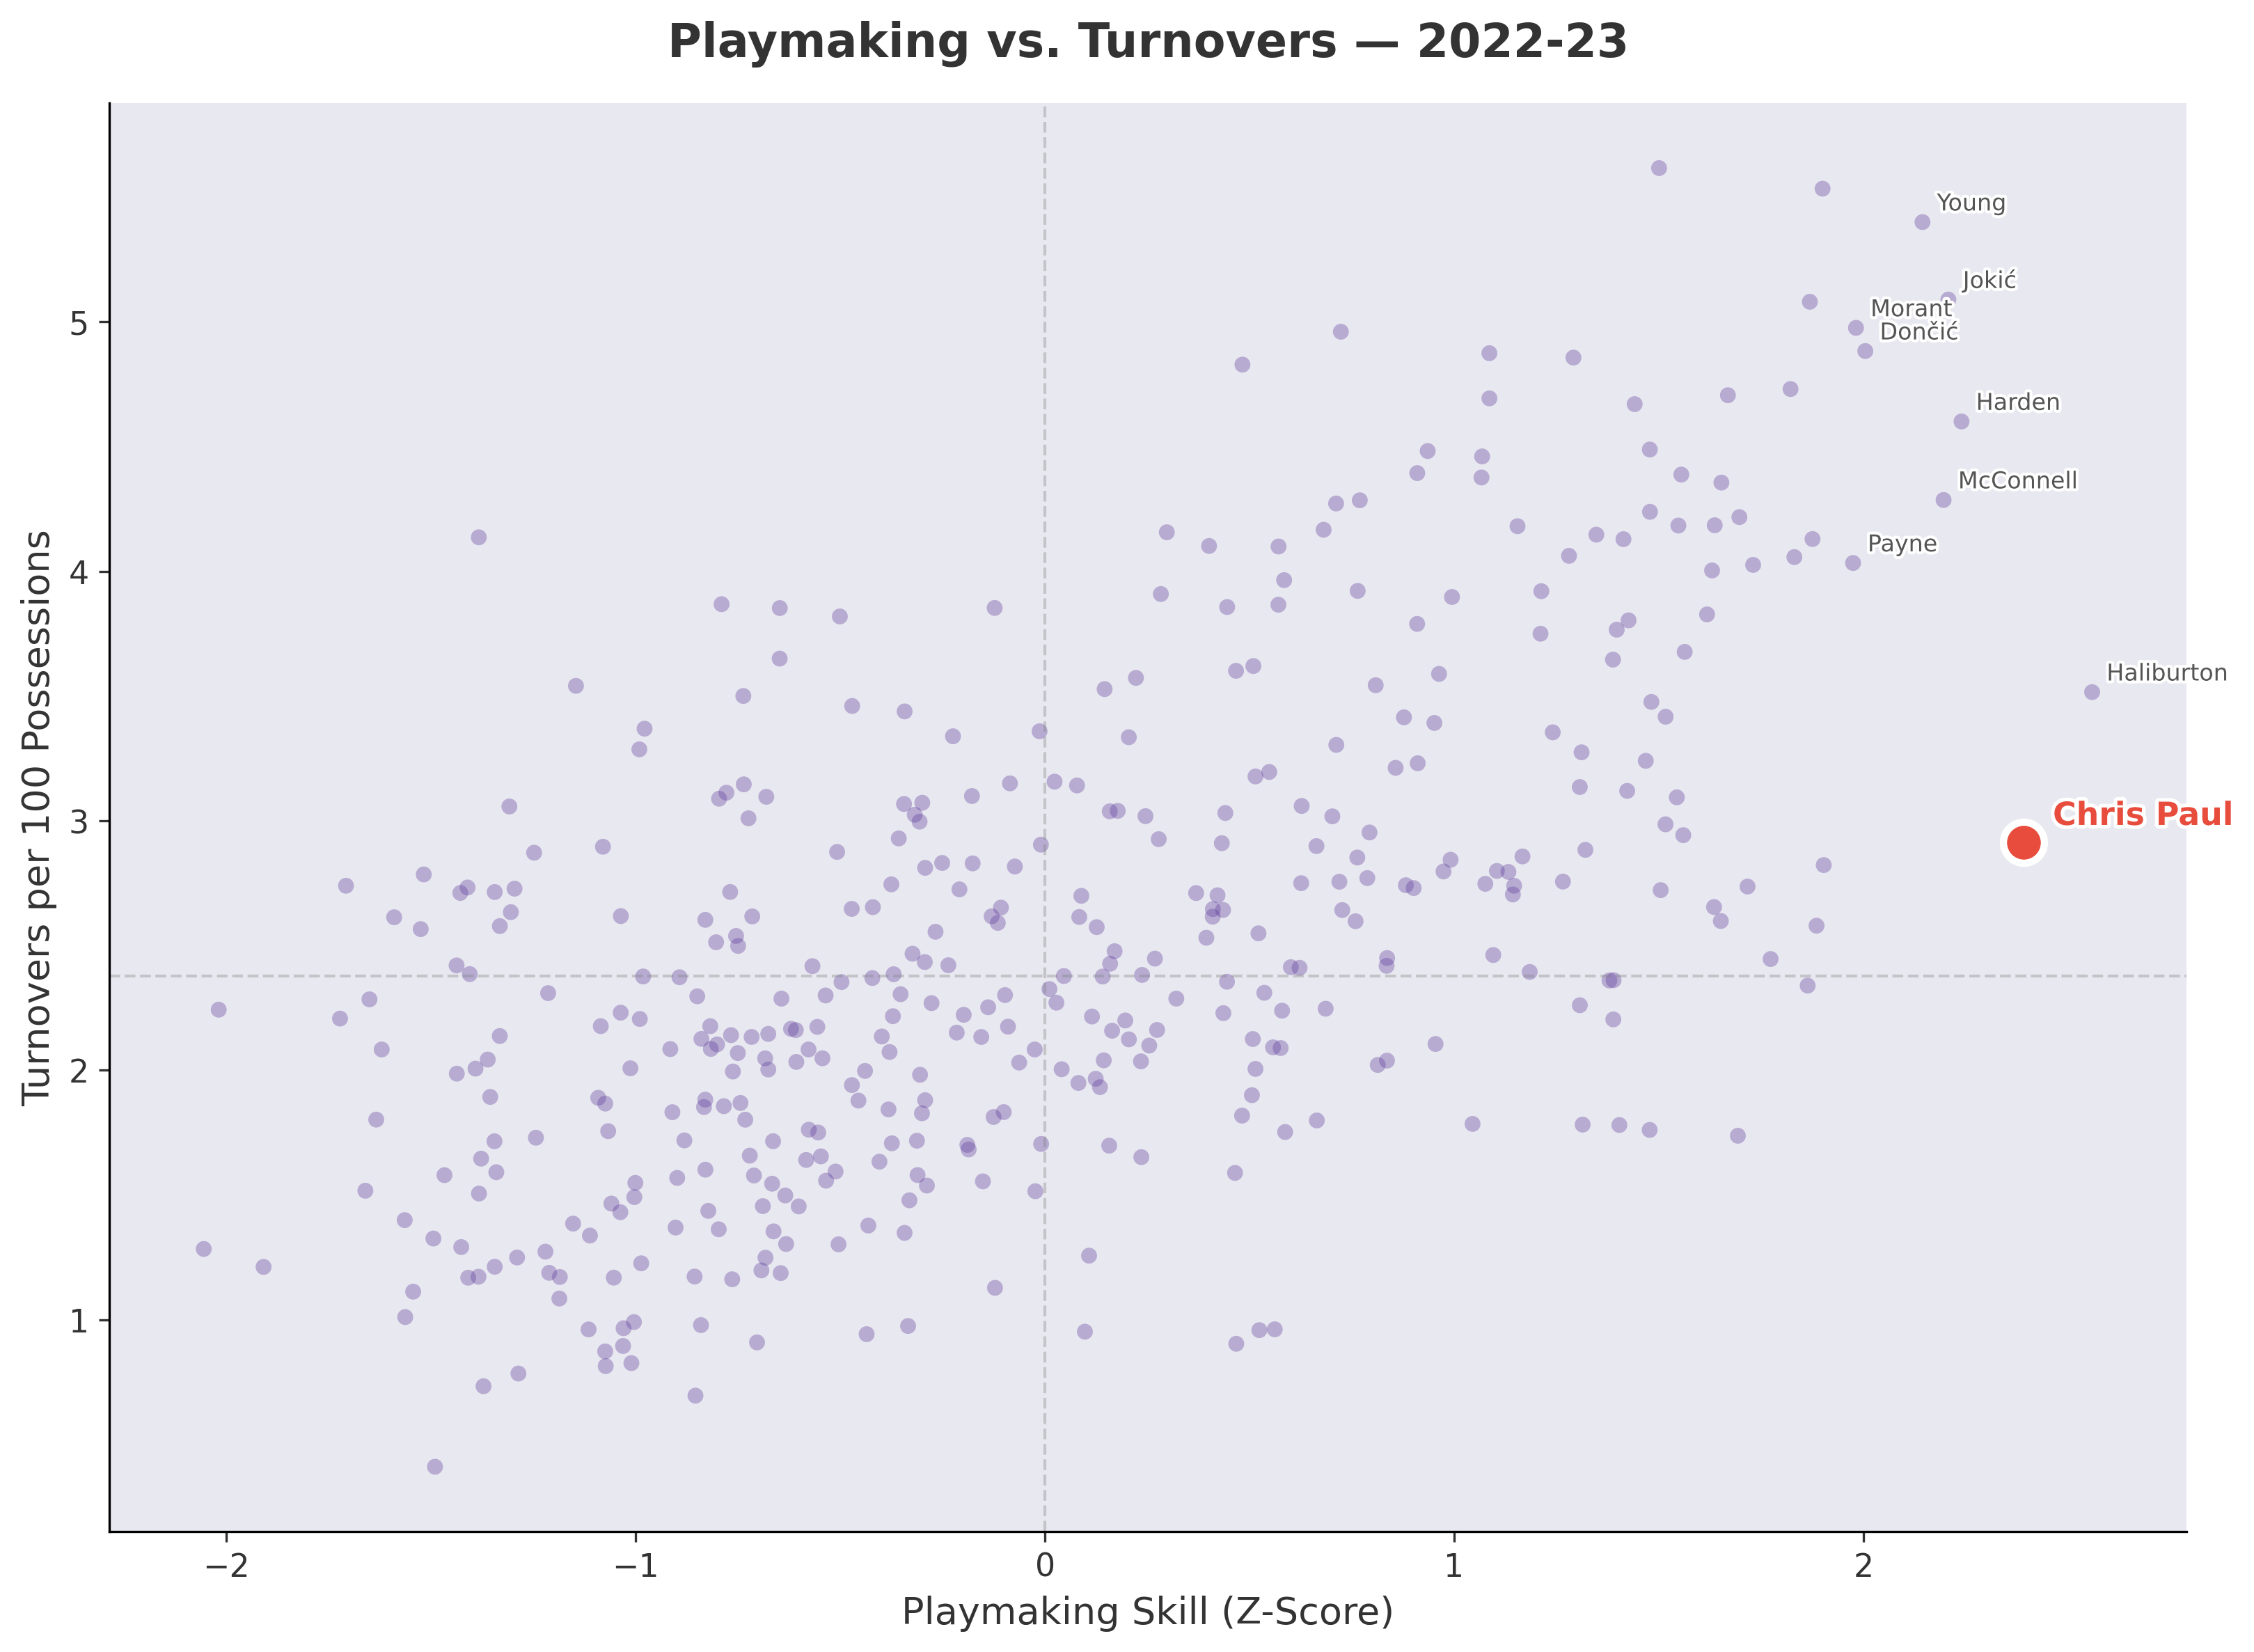
In the following plot, we’ll overlay all seasons since the 2013-14 season, and it’s remarkable how consistently Chris Paul sits in the bottom right corner. Each season is modeled independently (no parameters are learned across seasons), and each year Chris Paul always stands out with high playmaking, low turnovers.
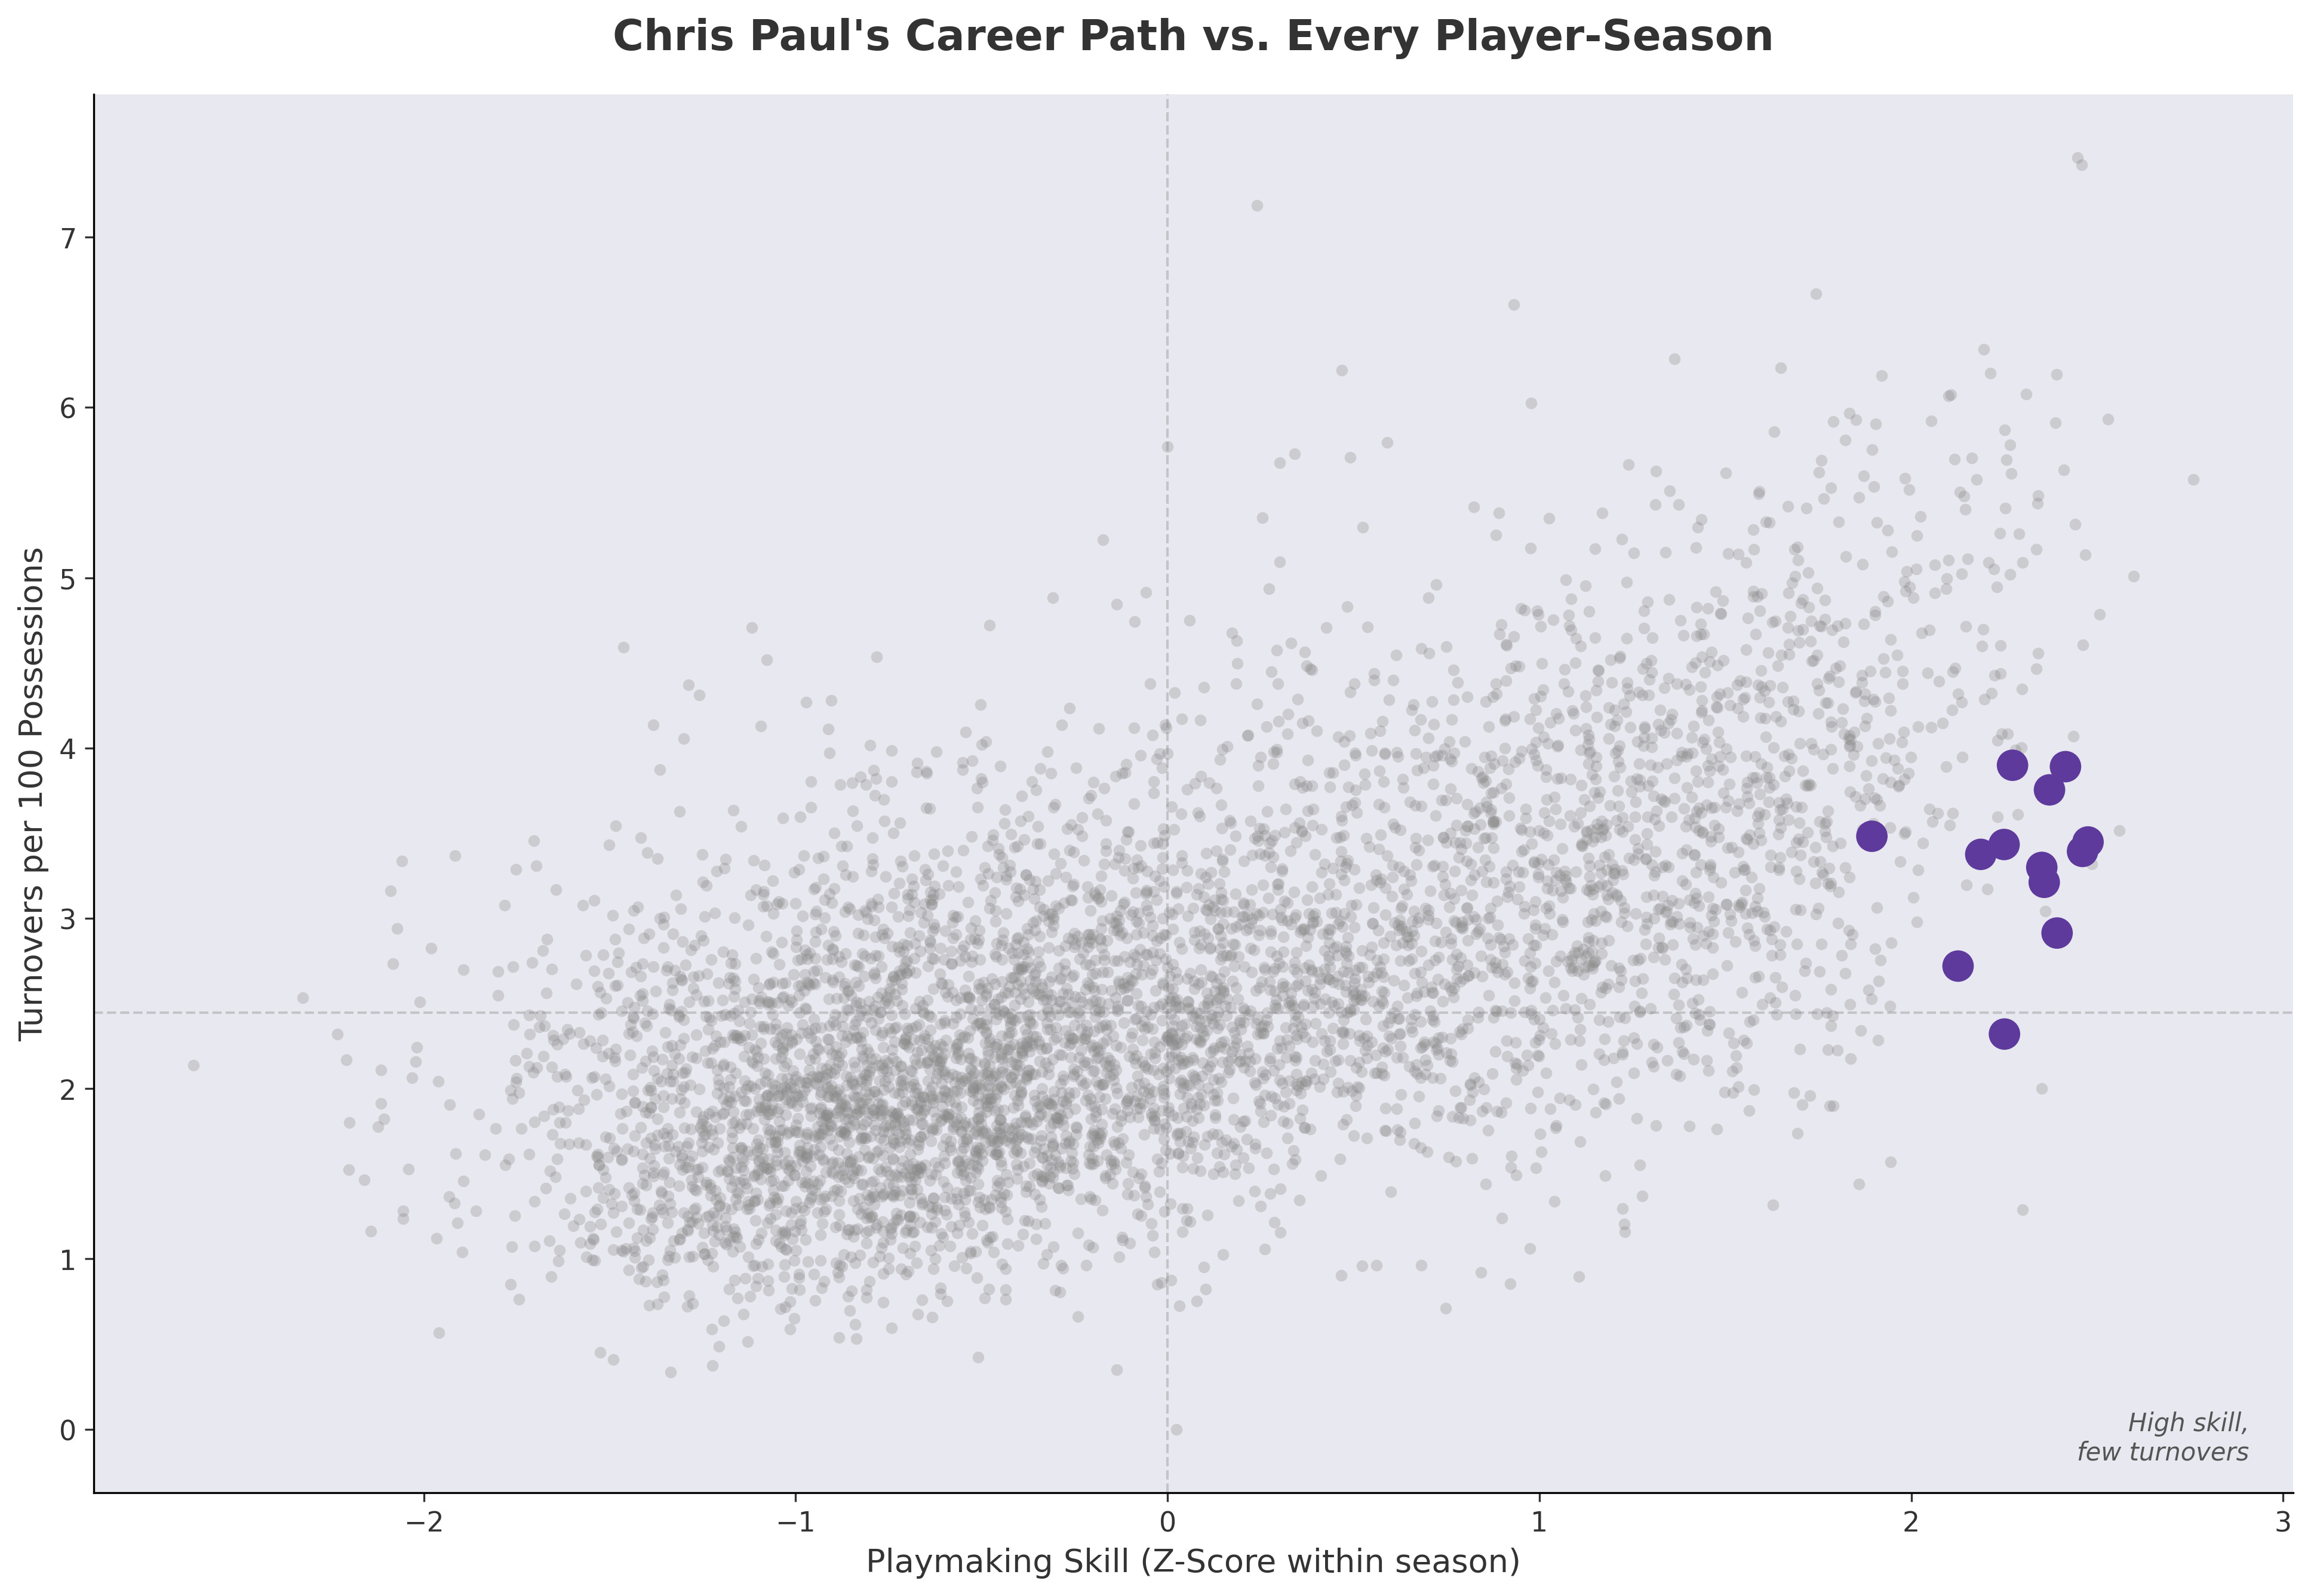
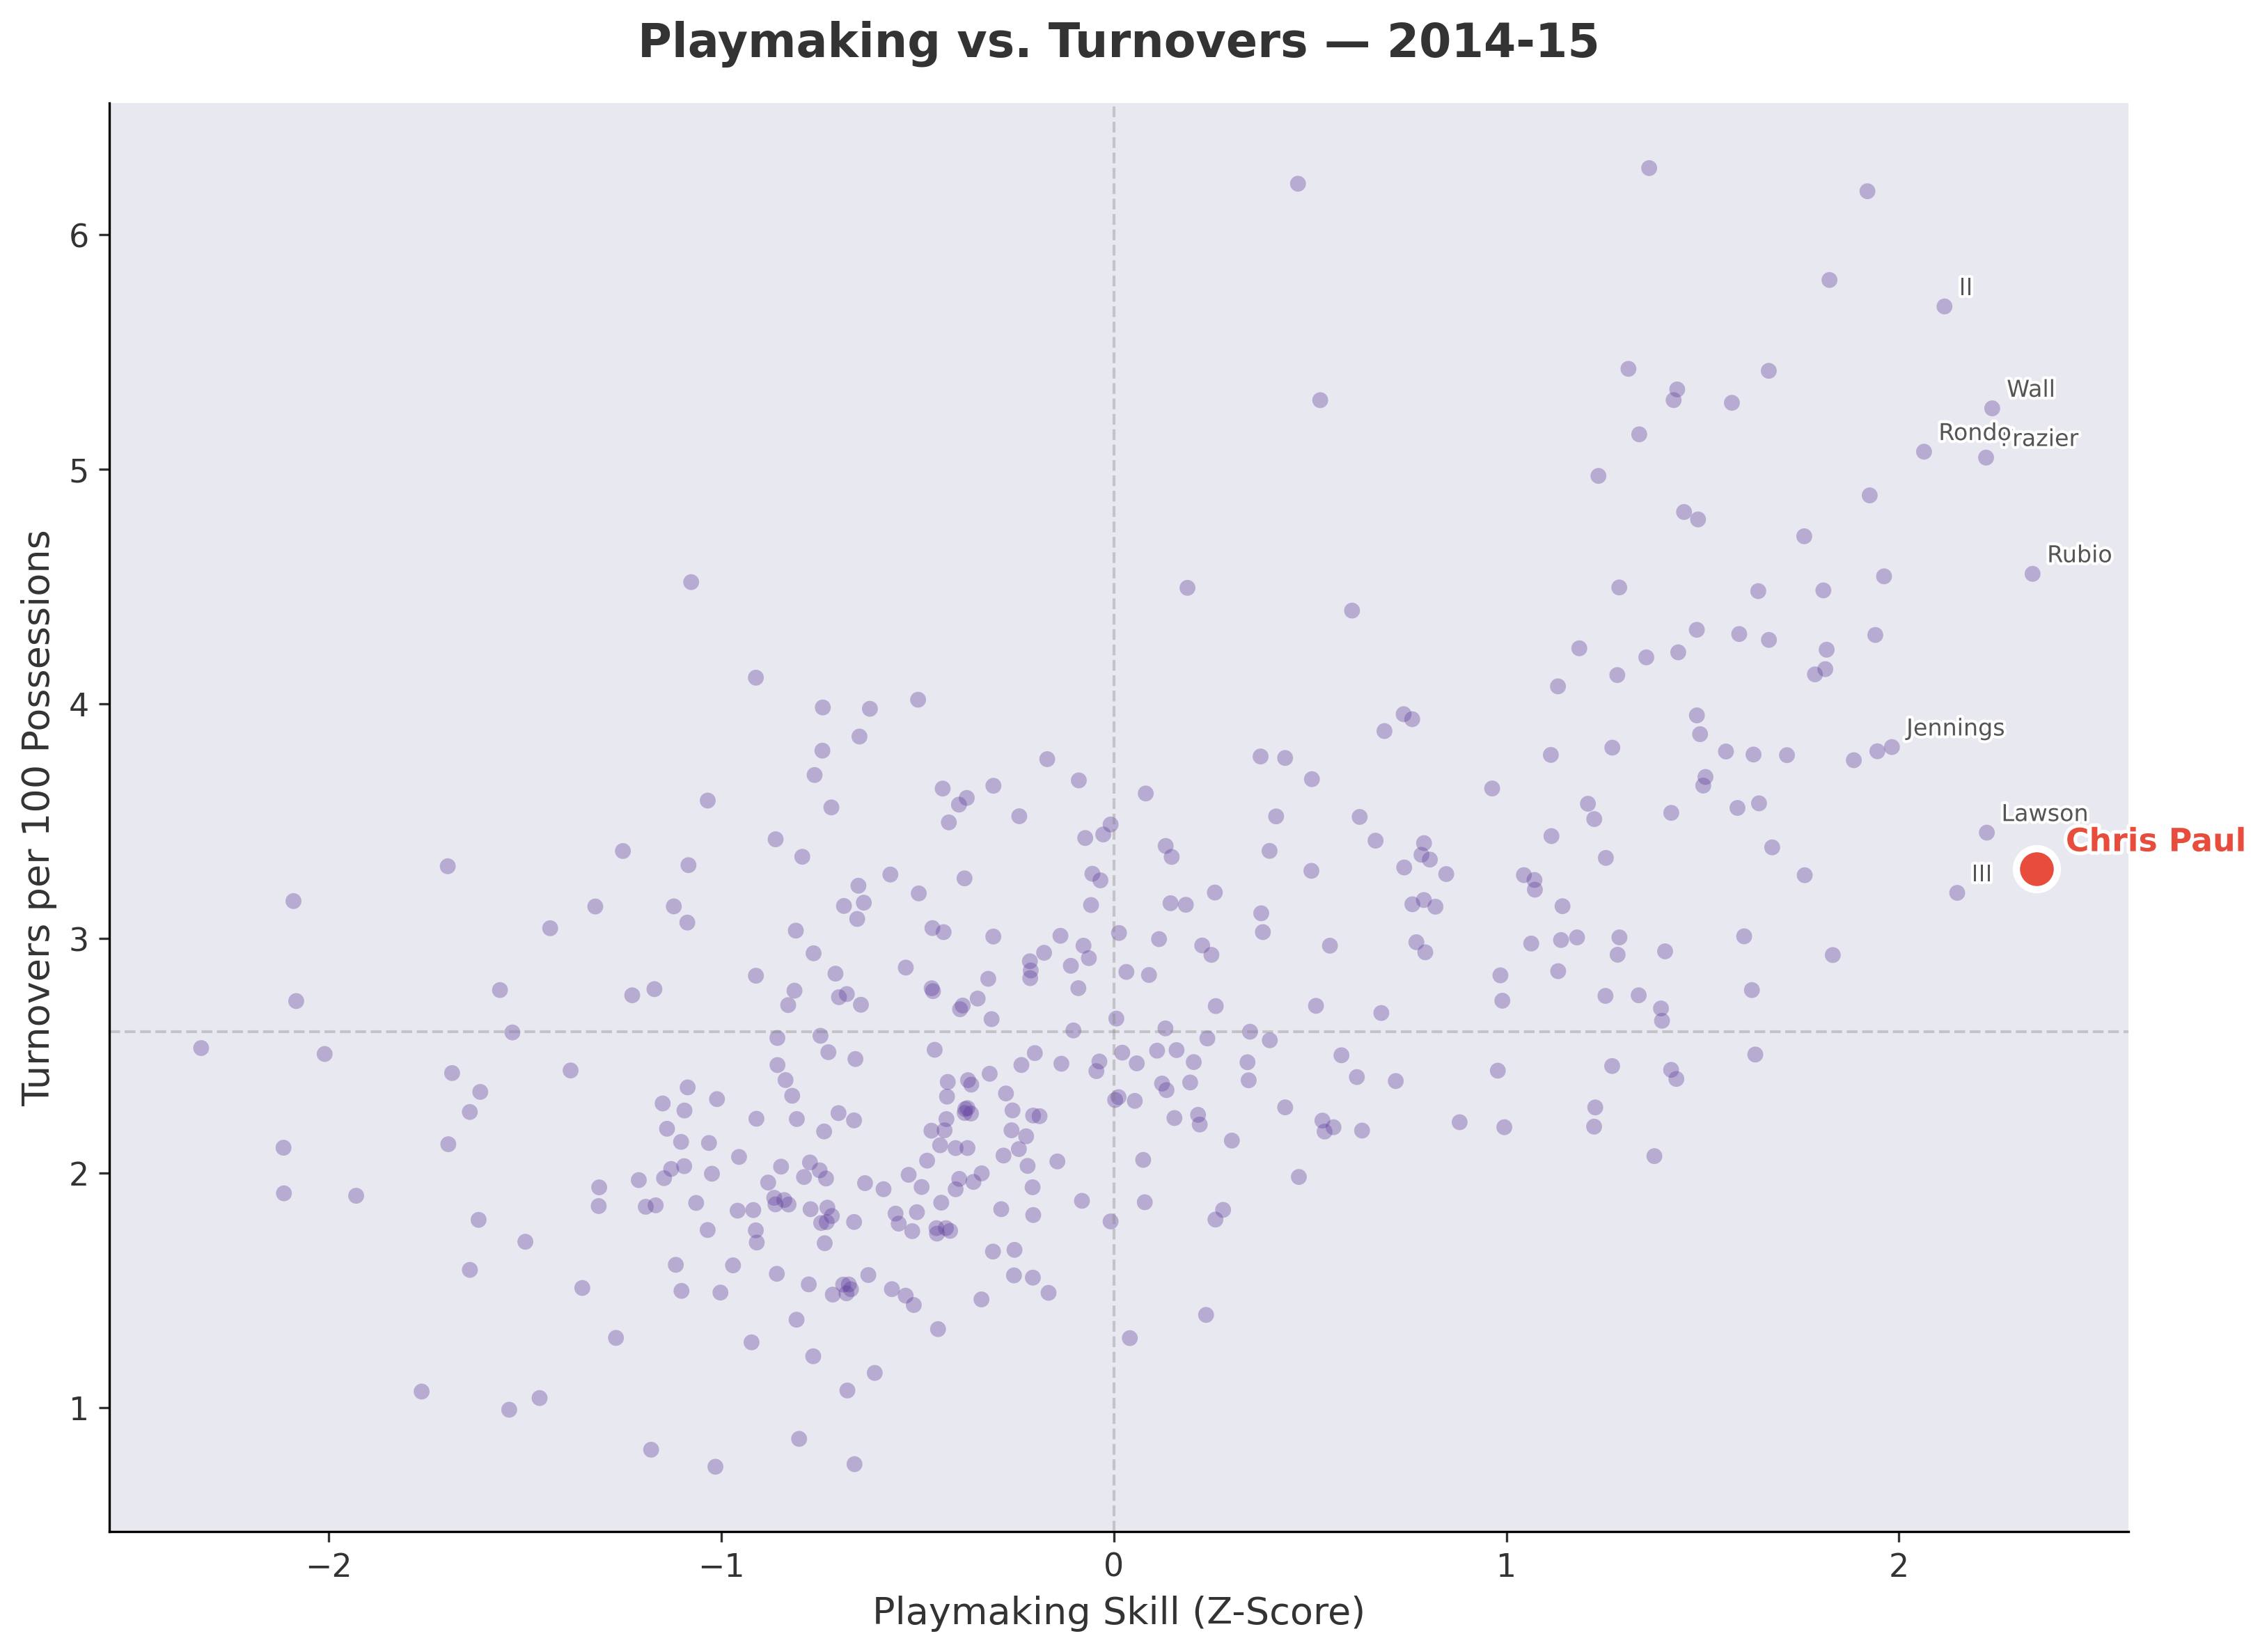
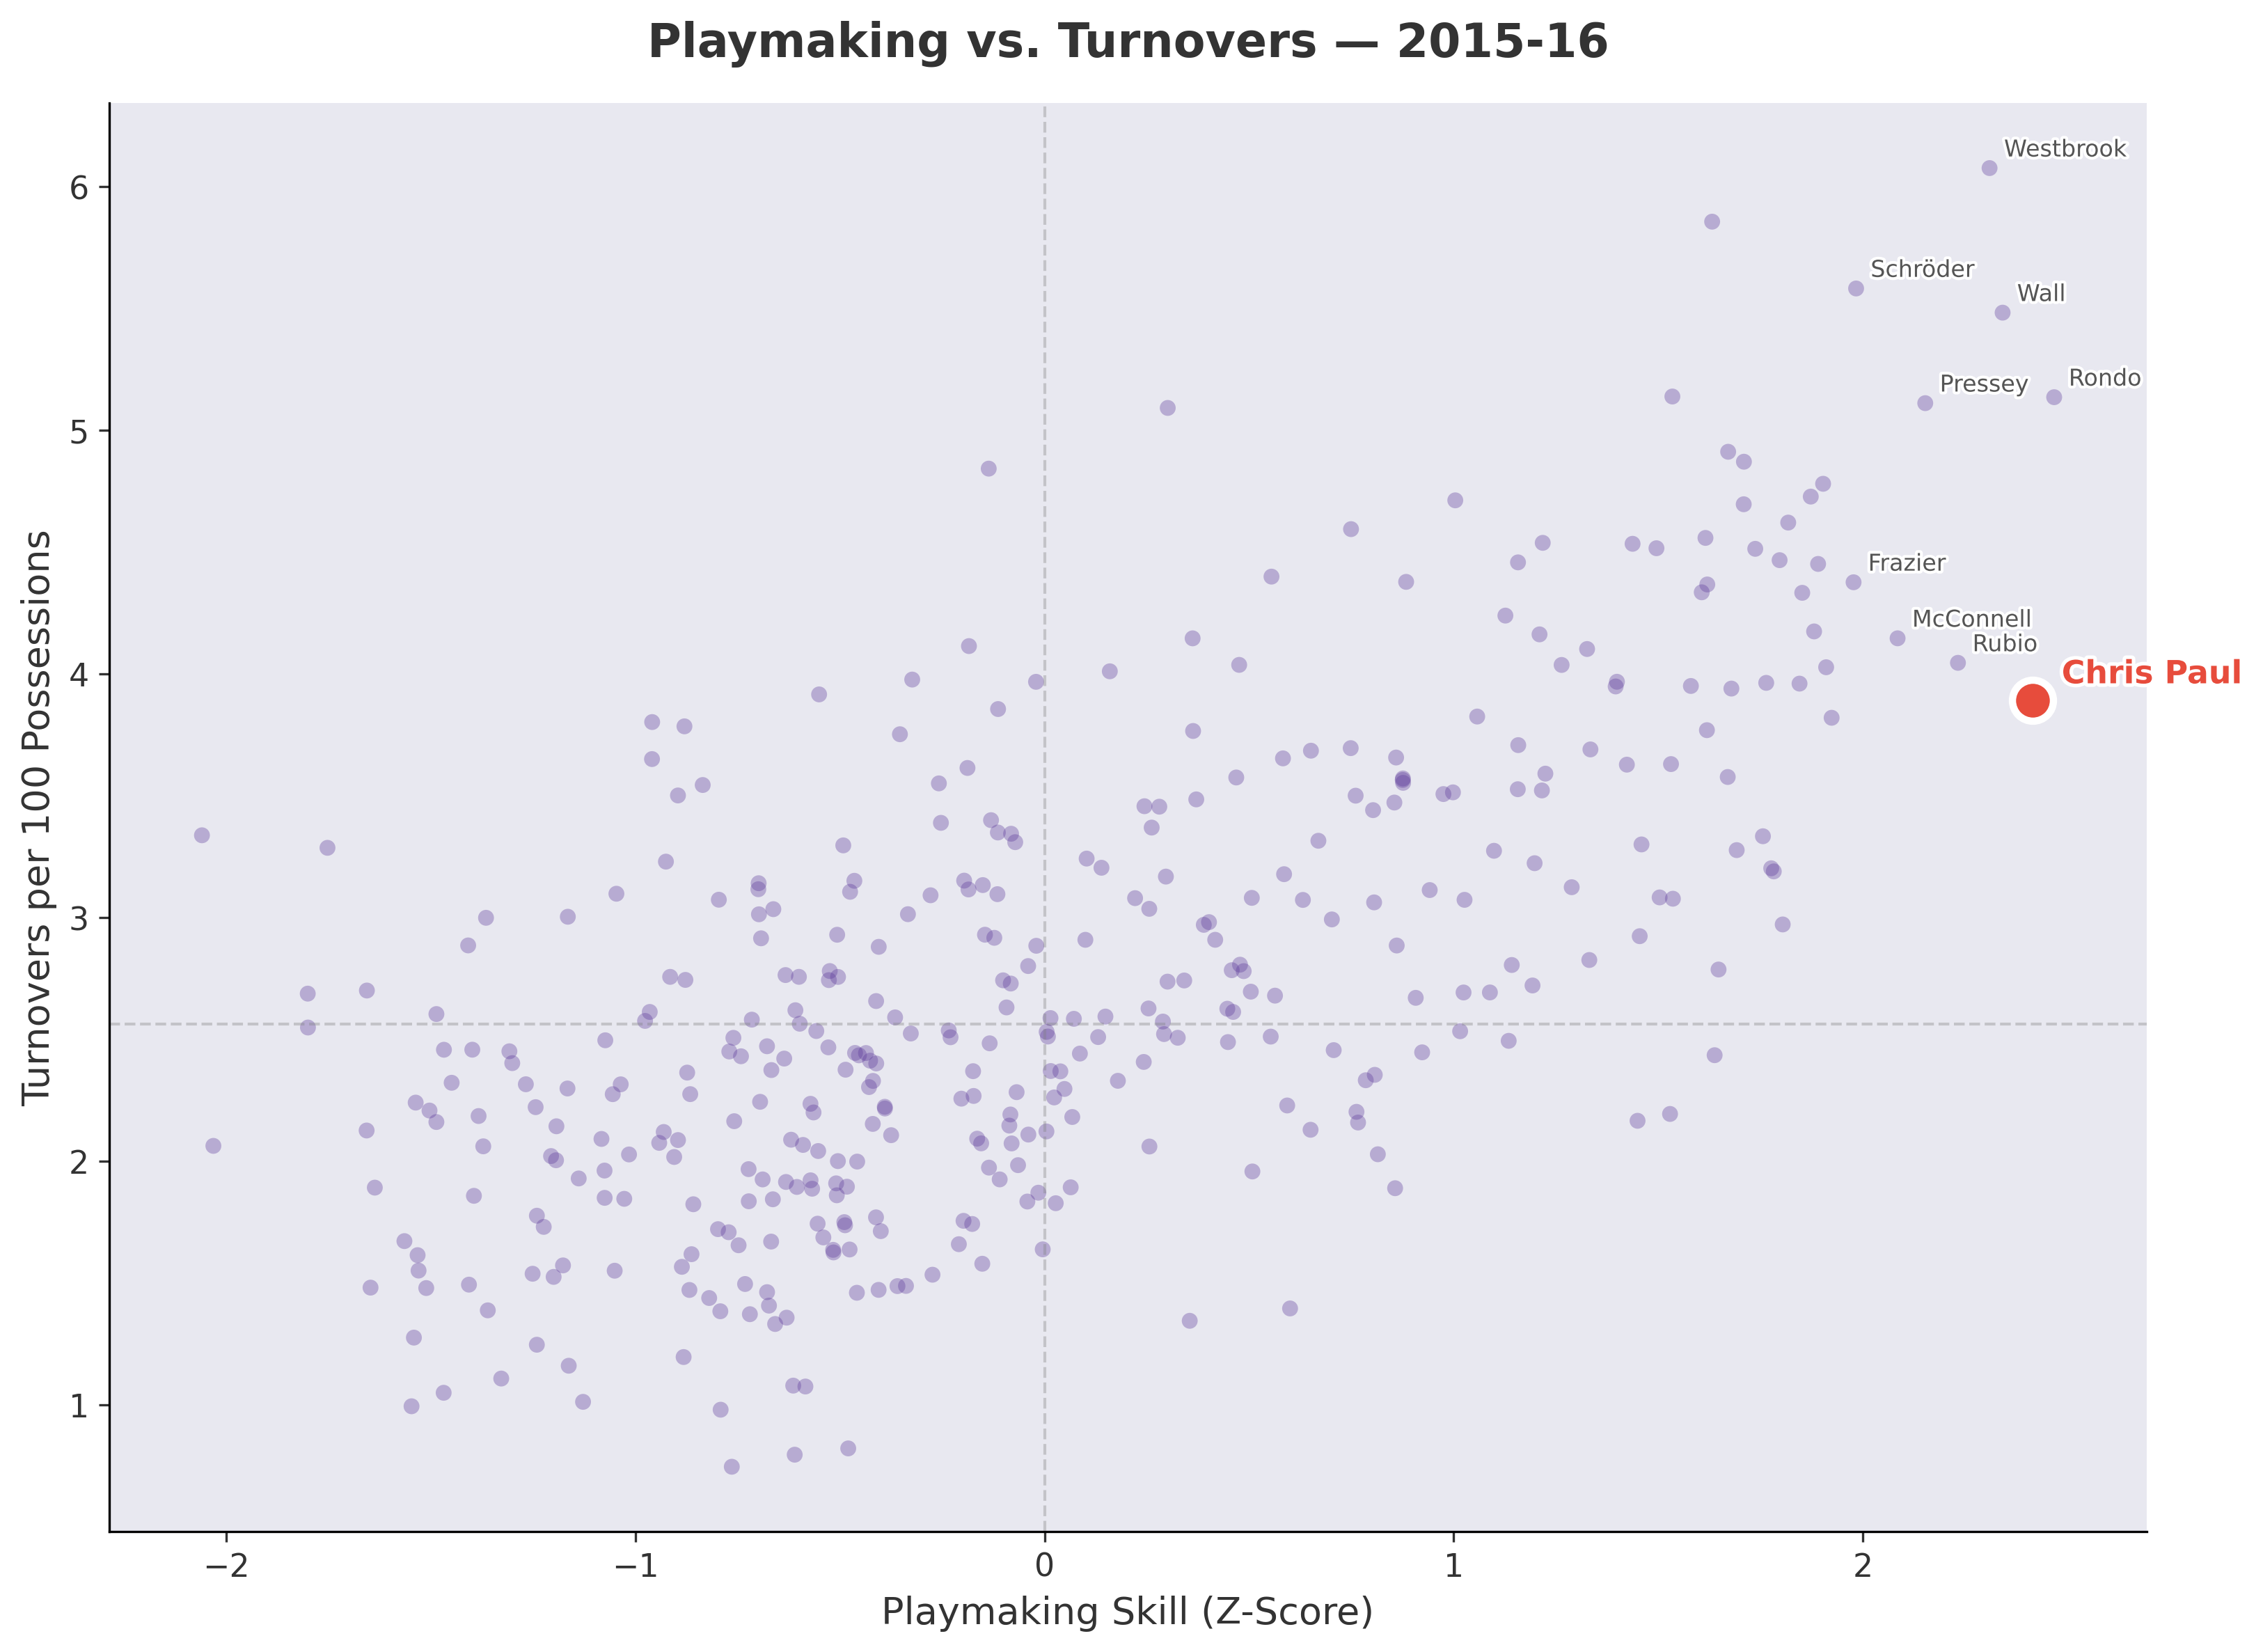
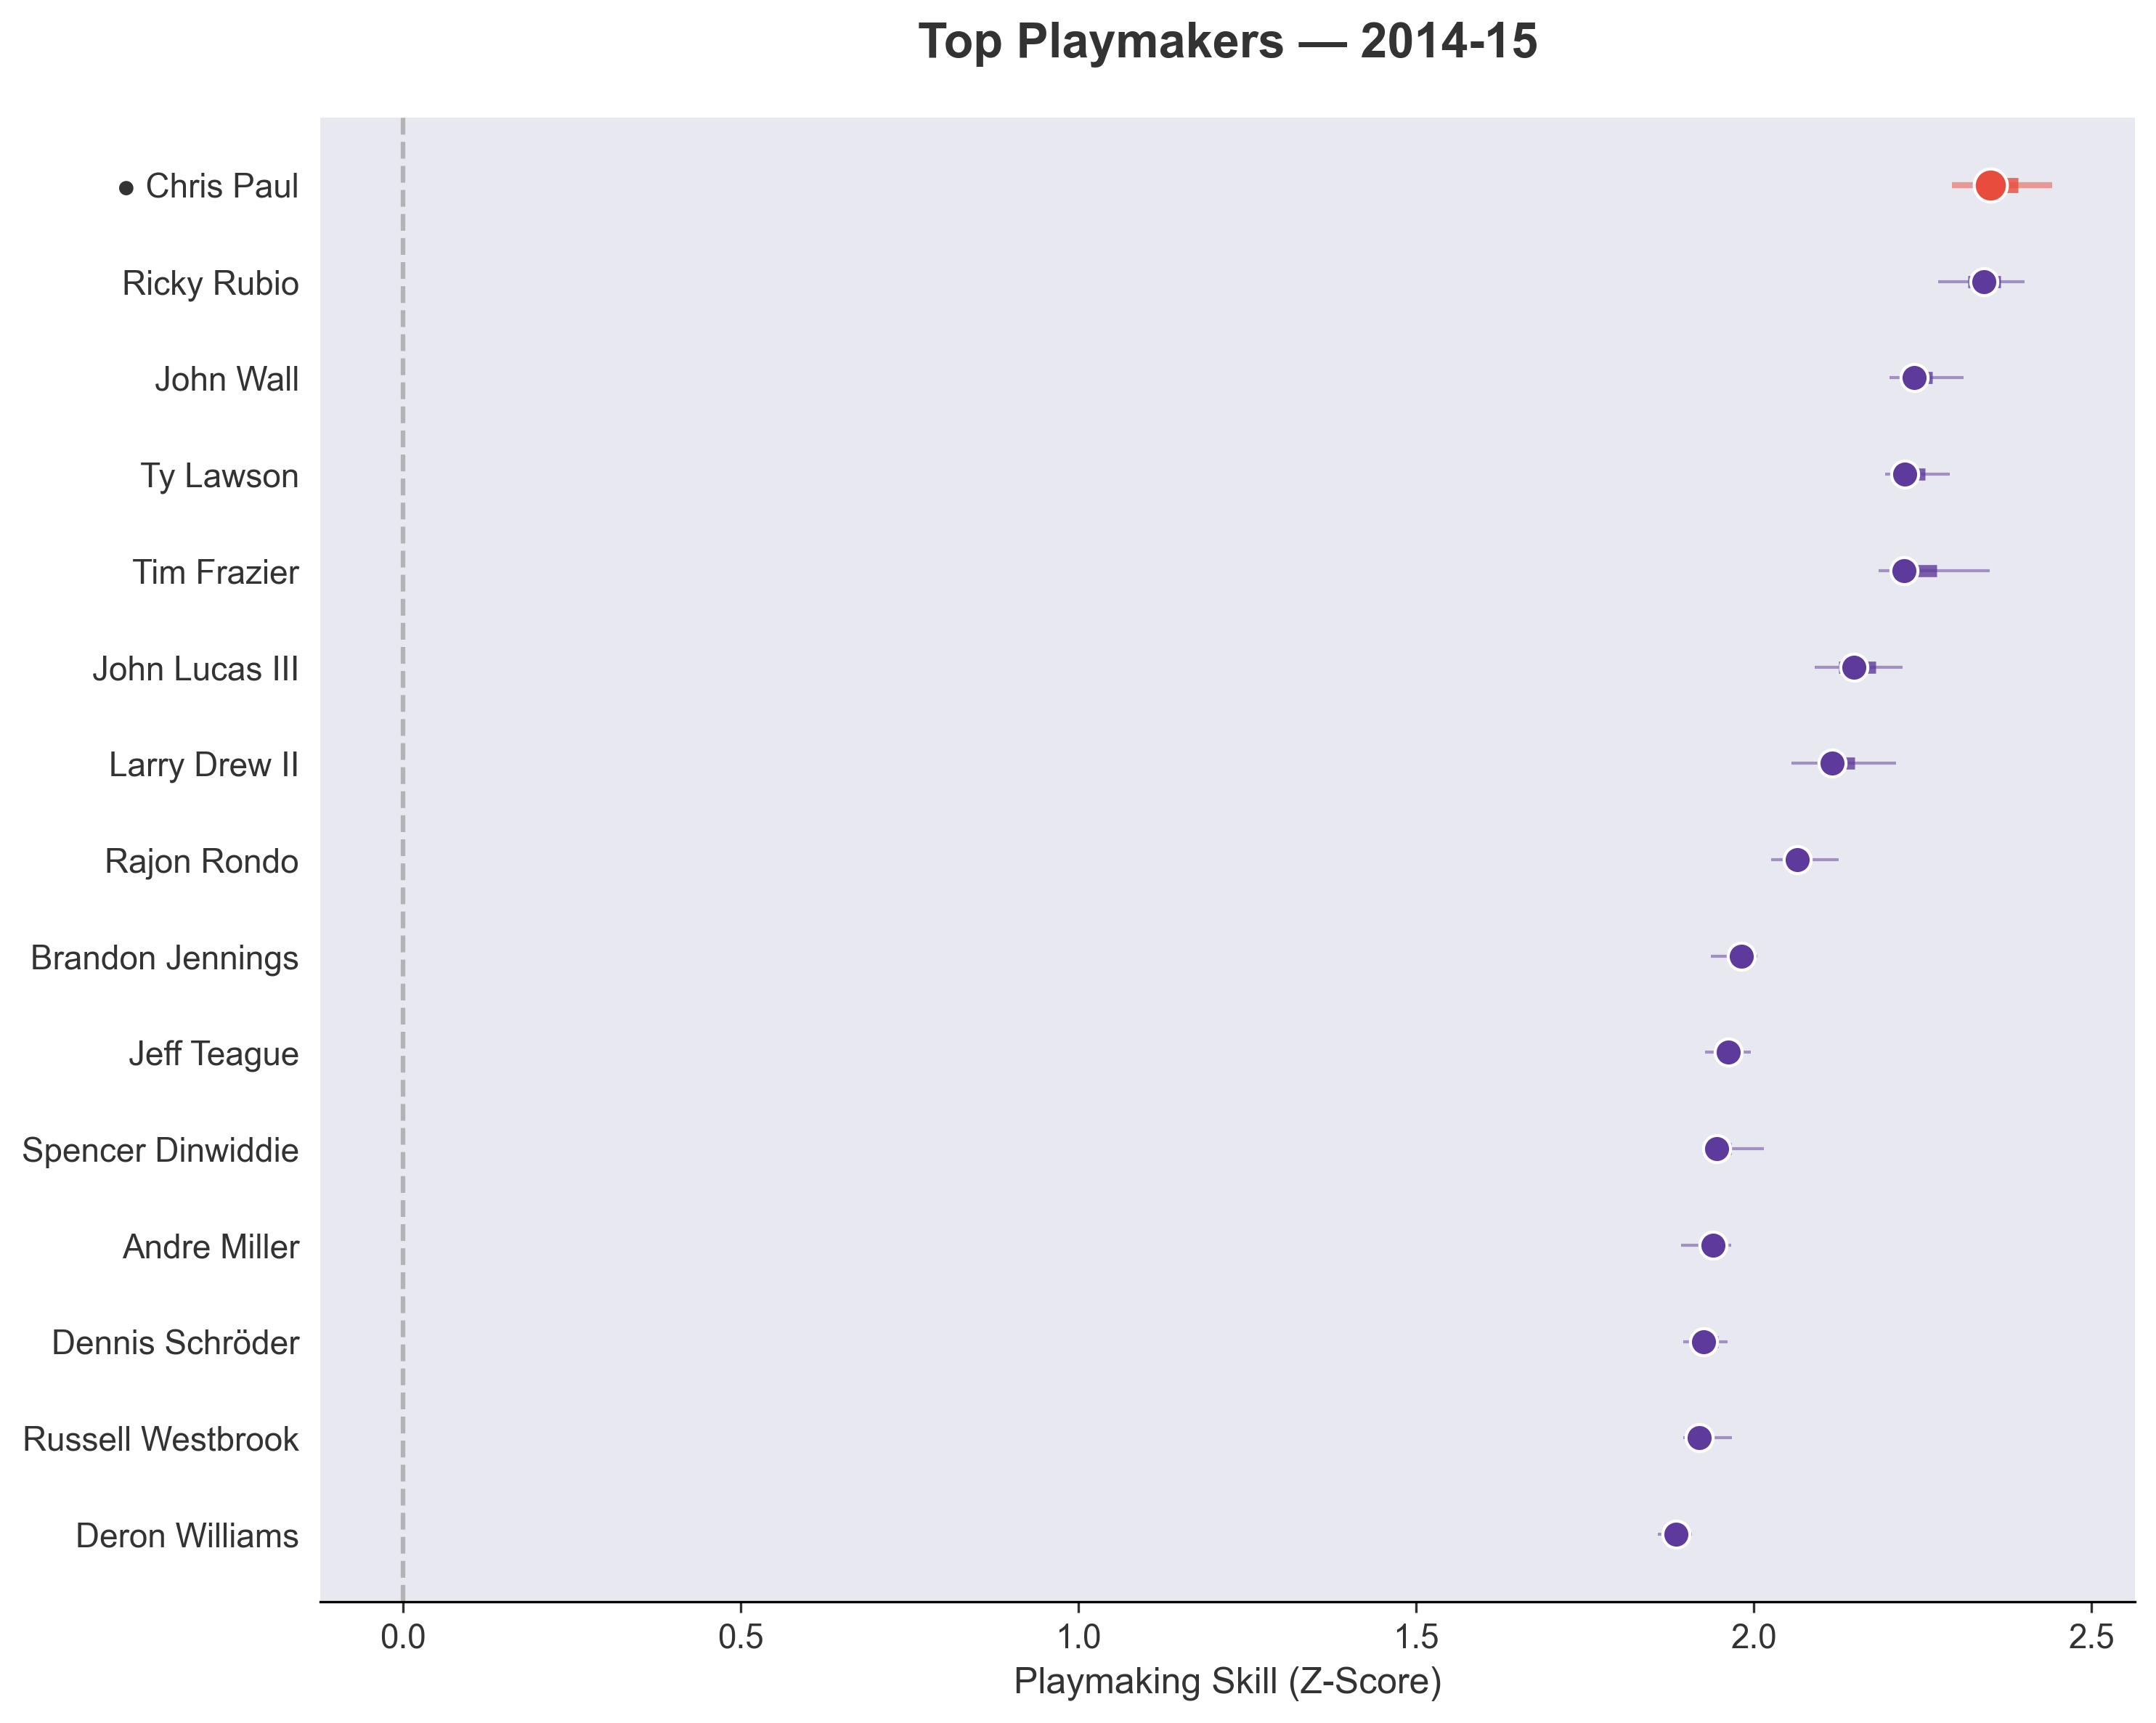
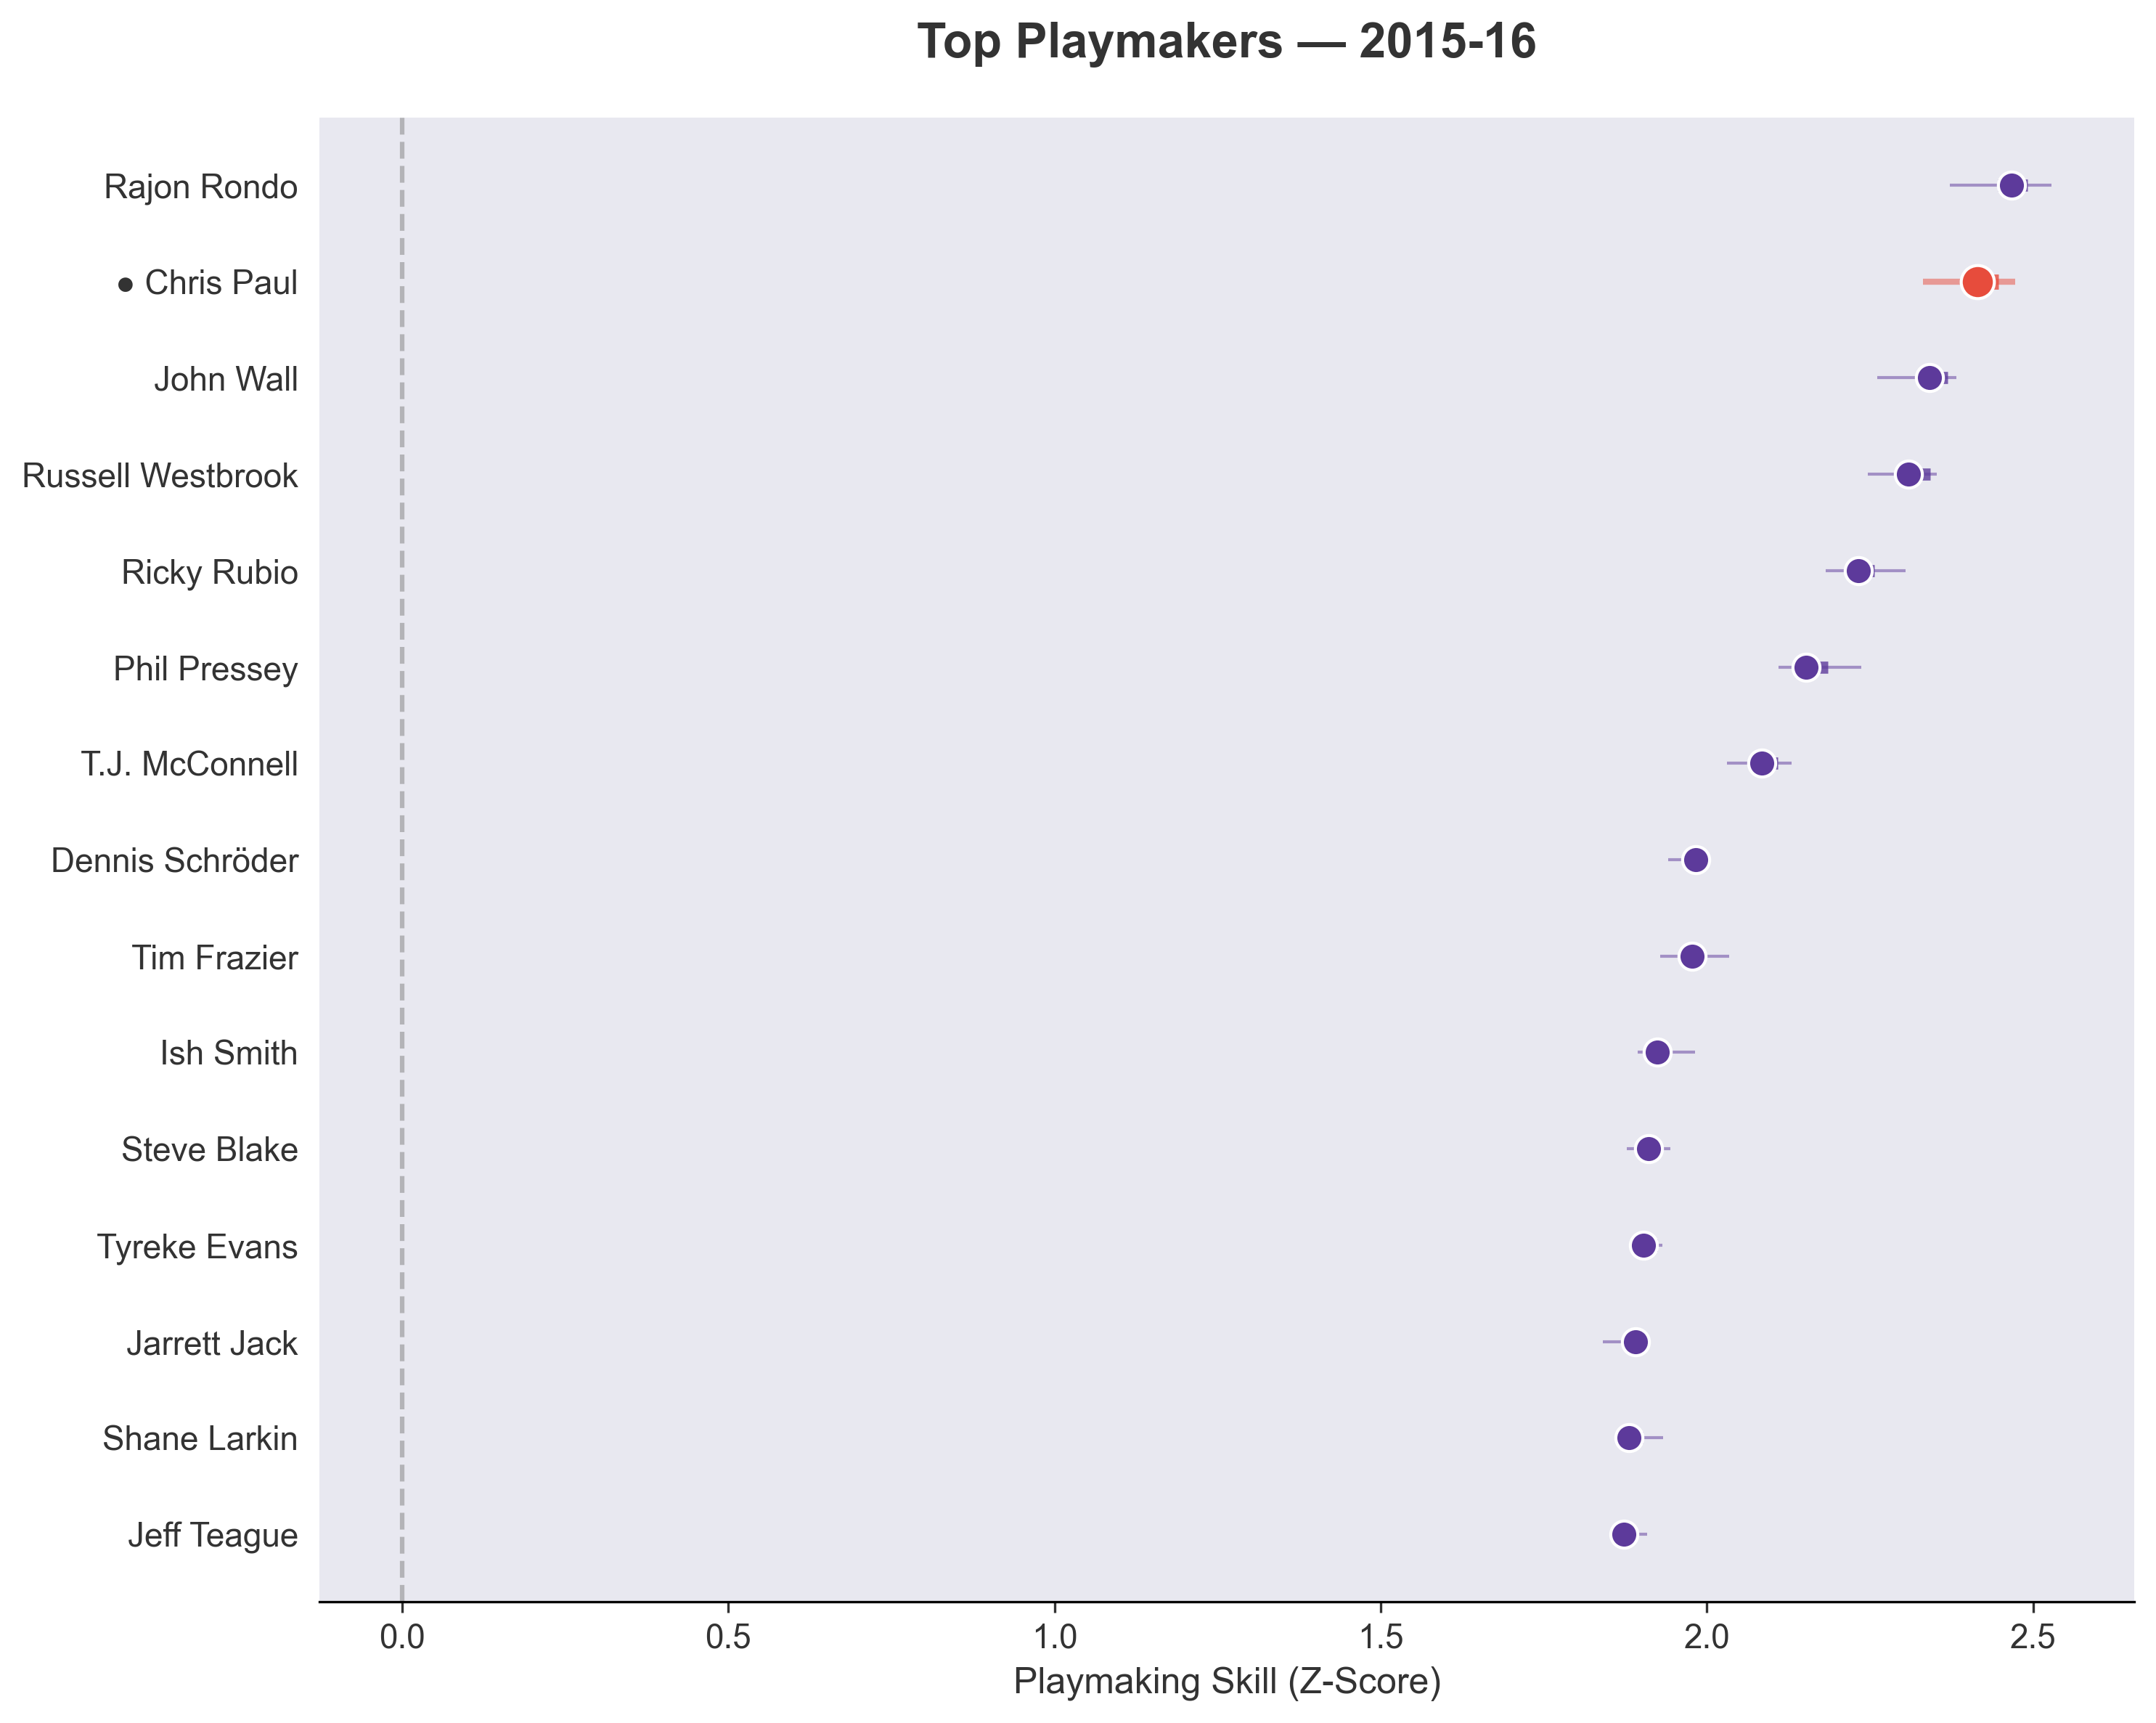
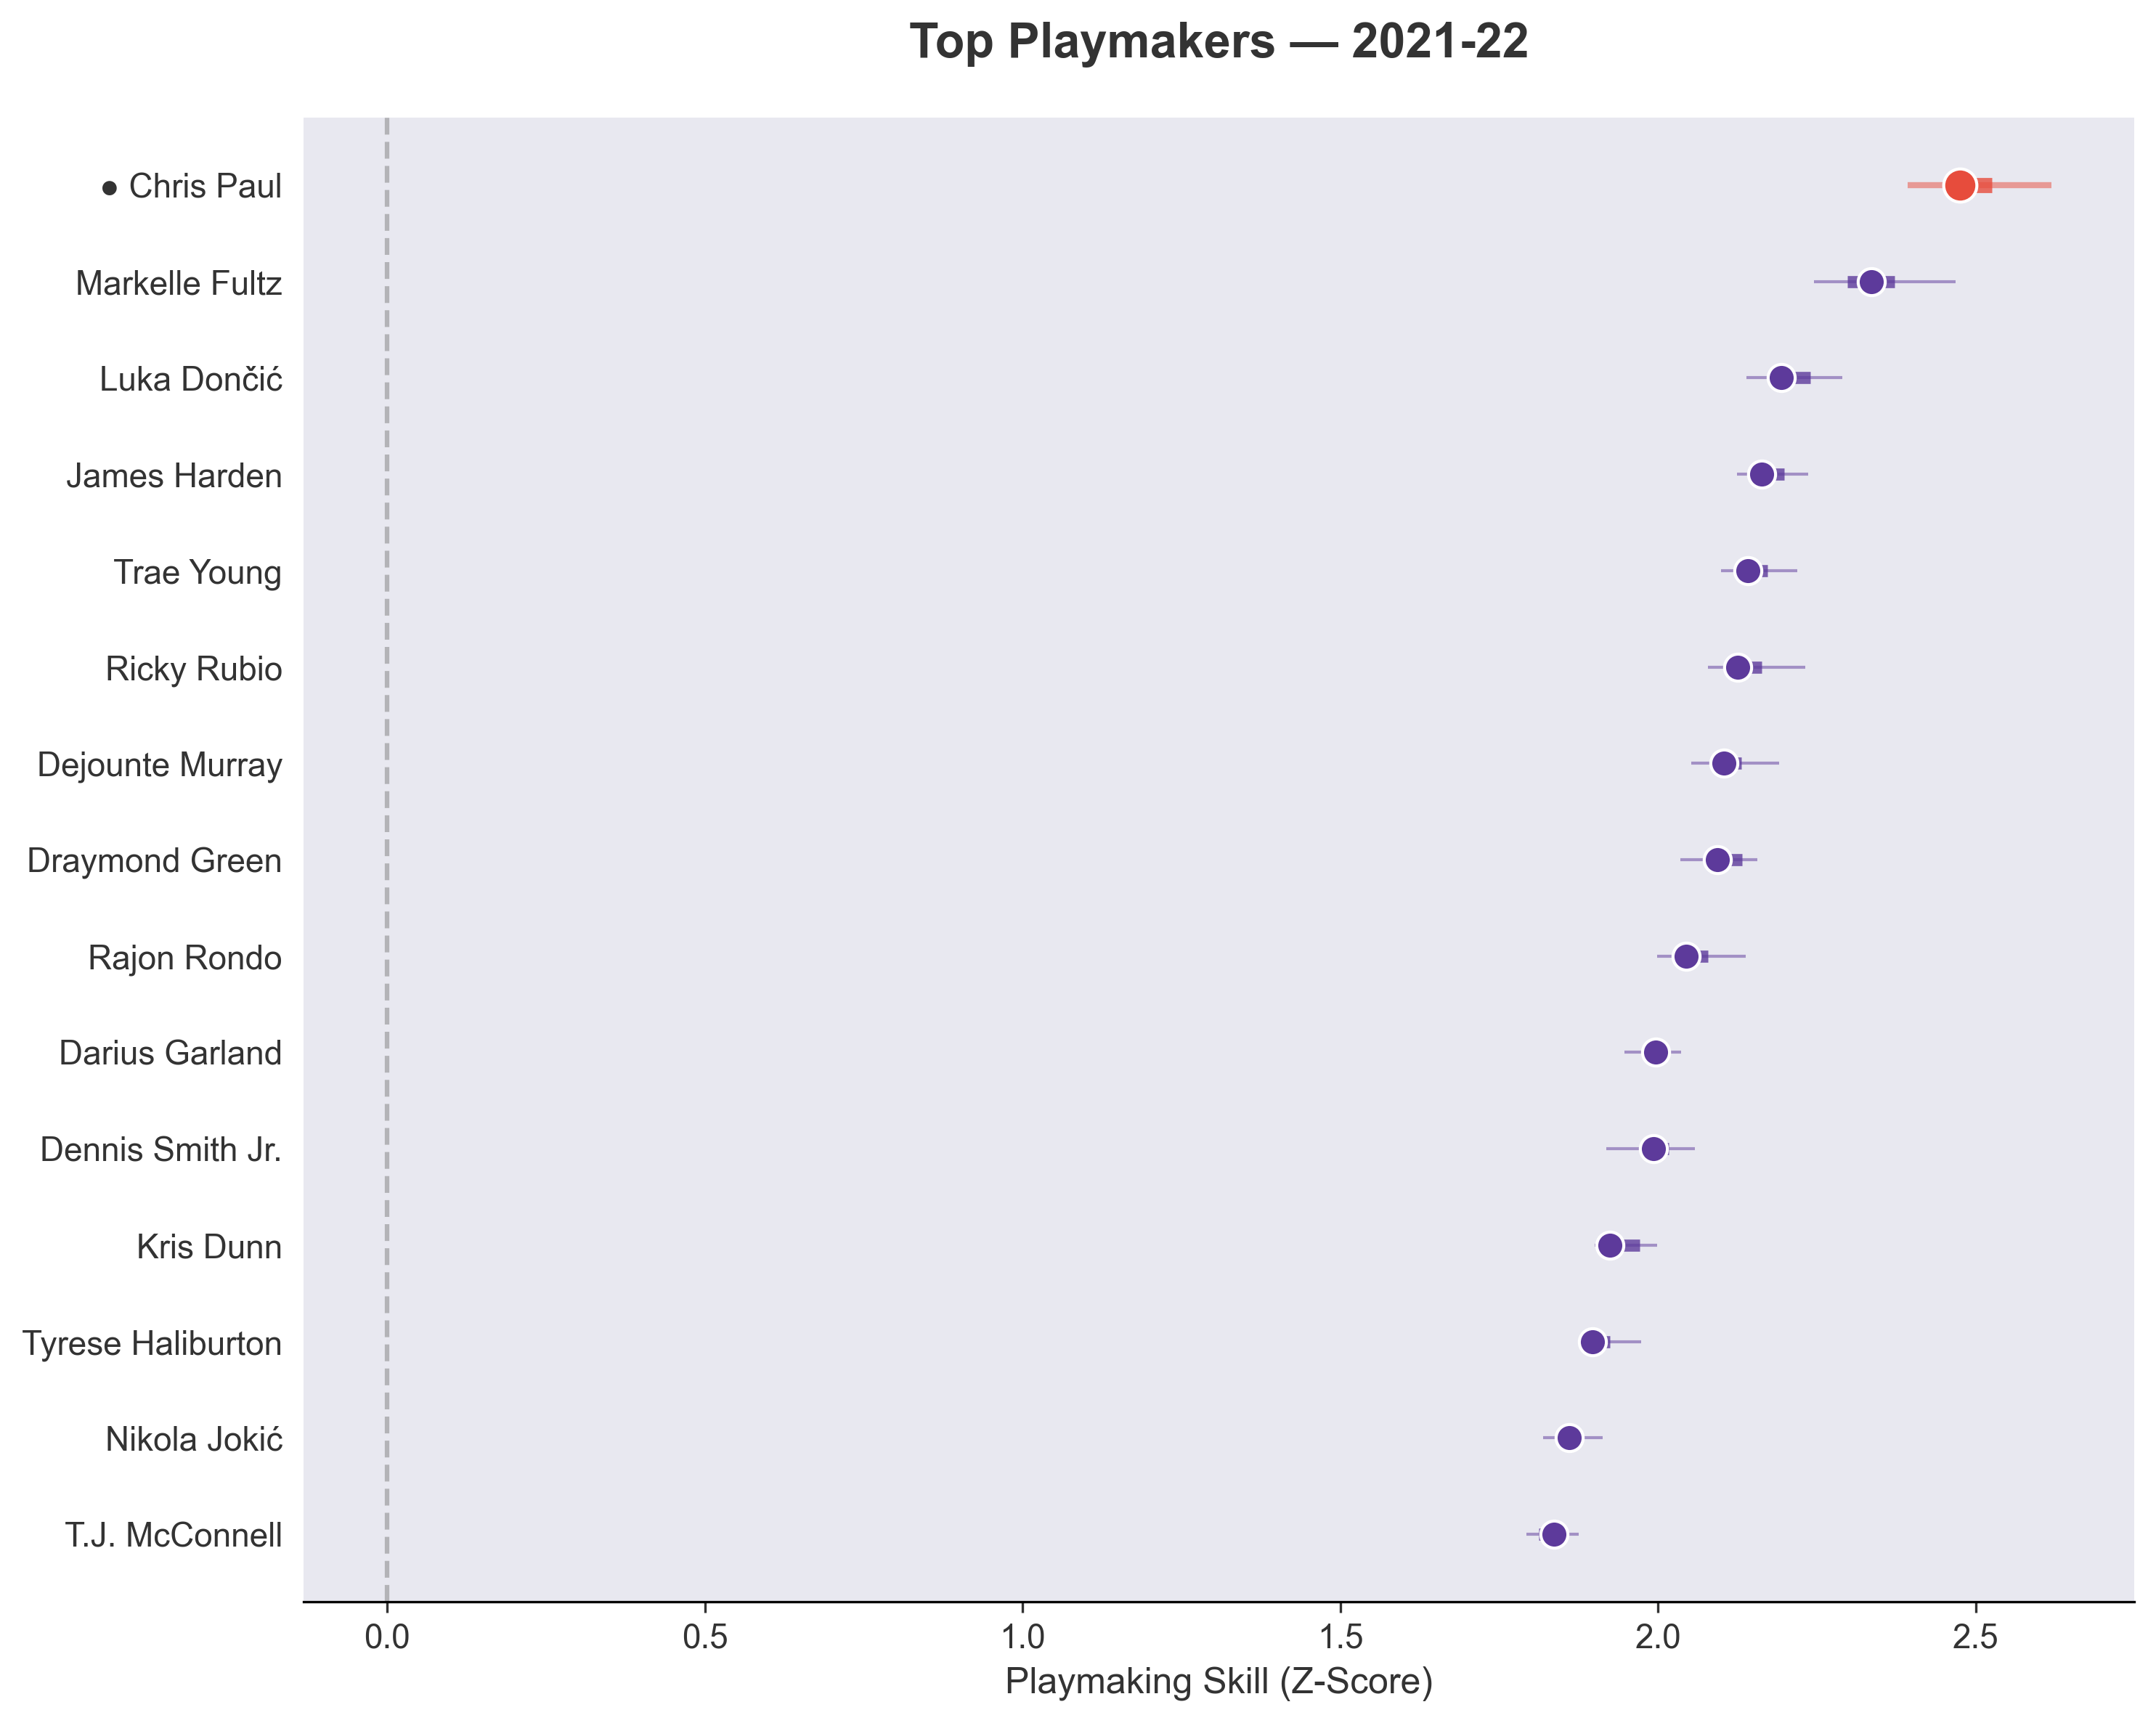
Here are a few handpicked single-season results:
Uncertainty in playmaking ability
As our models are fully Bayesian, we have uncertainty quantifications in the playmaking latent skill for each season (not shown on the above plots). Showing a few years:
Full Stan Model
data {
    int<lower=0> N;                     // Number of players
    vector[N] possessions;              // Exposure: Possessions
    vector[N] passes_made;              // Exposure: Passes

    // Counts (Poisson)
    array[N] int potential_ast;
    array[N] int secondary_ast;
    array[N] int turnovers;

    // Continuous (Normal)
    vector[N] ast_pts_created;

    // Groups
    int<lower=0> P;
    array[N] int<lower=1, upper=P> position;
}

parameters {
    // Latent Skill (Vision)
    vector[N] skill_raw;
    vector[P] mu_skill;
    real<lower=0> sigma_skill;

    // Discrimination & Intercepts (Per 100 Possessions)
    real beta0_pot;     real<lower=0> beta1_pot;
    real beta0_sec;     real<lower=0> beta1_sec;

    // Turnovers (Per 100 Passes)
    real beta0_tov;     real<lower=0> beta1_tov;

    // Points Created (Continuous)
    real alpha_pts;     real<lower=0> beta_pts;  real<lower=0> sigma_pts;
}

transformed parameters {
    vector[N] skill;
    for (i in 1:N) {
        skill[i] = mu_skill[position[i]] + skill_raw[i] * sigma_skill;
    }
}

model {
    // Hierarchical Skill Priors
    skill_raw ~ std_normal();
    mu_skill ~ normal(0, 1);
    sigma_skill ~ normal(0, 1);

    // Priors for Counts (Log scale)
    beta0_pot ~ normal(2.5, 1);    beta1_pot ~ normal(0.5, 0.5);
    beta0_sec ~ normal(0.5, 1);    beta1_sec ~ normal(0.5, 0.5);

    // Priors for Turnovers
    beta0_tov ~ normal(-2.5, 1);   beta1_tov ~ normal(0.5, 0.5);

    // Priors for Continuous
    alpha_pts ~ normal(30, 10); beta_pts ~ normal(5, 5); sigma_pts ~ normal(5, 5);

    // Likelihoods
    // 1. Potential Assists
    potential_ast ~ poisson_log(log(possessions) + beta0_pot + beta1_pot * skill);

    // 2. Secondary Assists
    secondary_ast ~ poisson_log(log(possessions) + beta0_sec + beta1_sec * skill);

    // 3. Turnovers (Negative relationship with Skill)
    turnovers ~ poisson_log(log(passes_made) + beta0_tov - beta1_tov * skill);

    // 4. Assist Points Created
    ast_pts_created ./ (possessions / 100.0 + 1e-9) ~ normal(alpha_pts + beta_pts * skill, sigma_pts);
}

generated quantities {
    vector[N] skill_out = skill;
}
Wizards legend!
Who is the dot just below the X axis with the very high playmaking score?