
Free Throw Shooting by Position
Refining our free throw modeling

Bayesian hierarchical models help when you have limited data (e.g. halfway through the season). Here we refine our estimates by incorporating positional information into our model.
The full model is at the bottom of the post, but to explain it simply: for each position we learn the distribution of free throw shooting ability, which helps inform estimates for each player of that position.
If we see someone shoot 13 out of 13 so far this season, we expect their true FT% to be different if that player is a center vs a guard. This model accounts for that.
Position Distributions
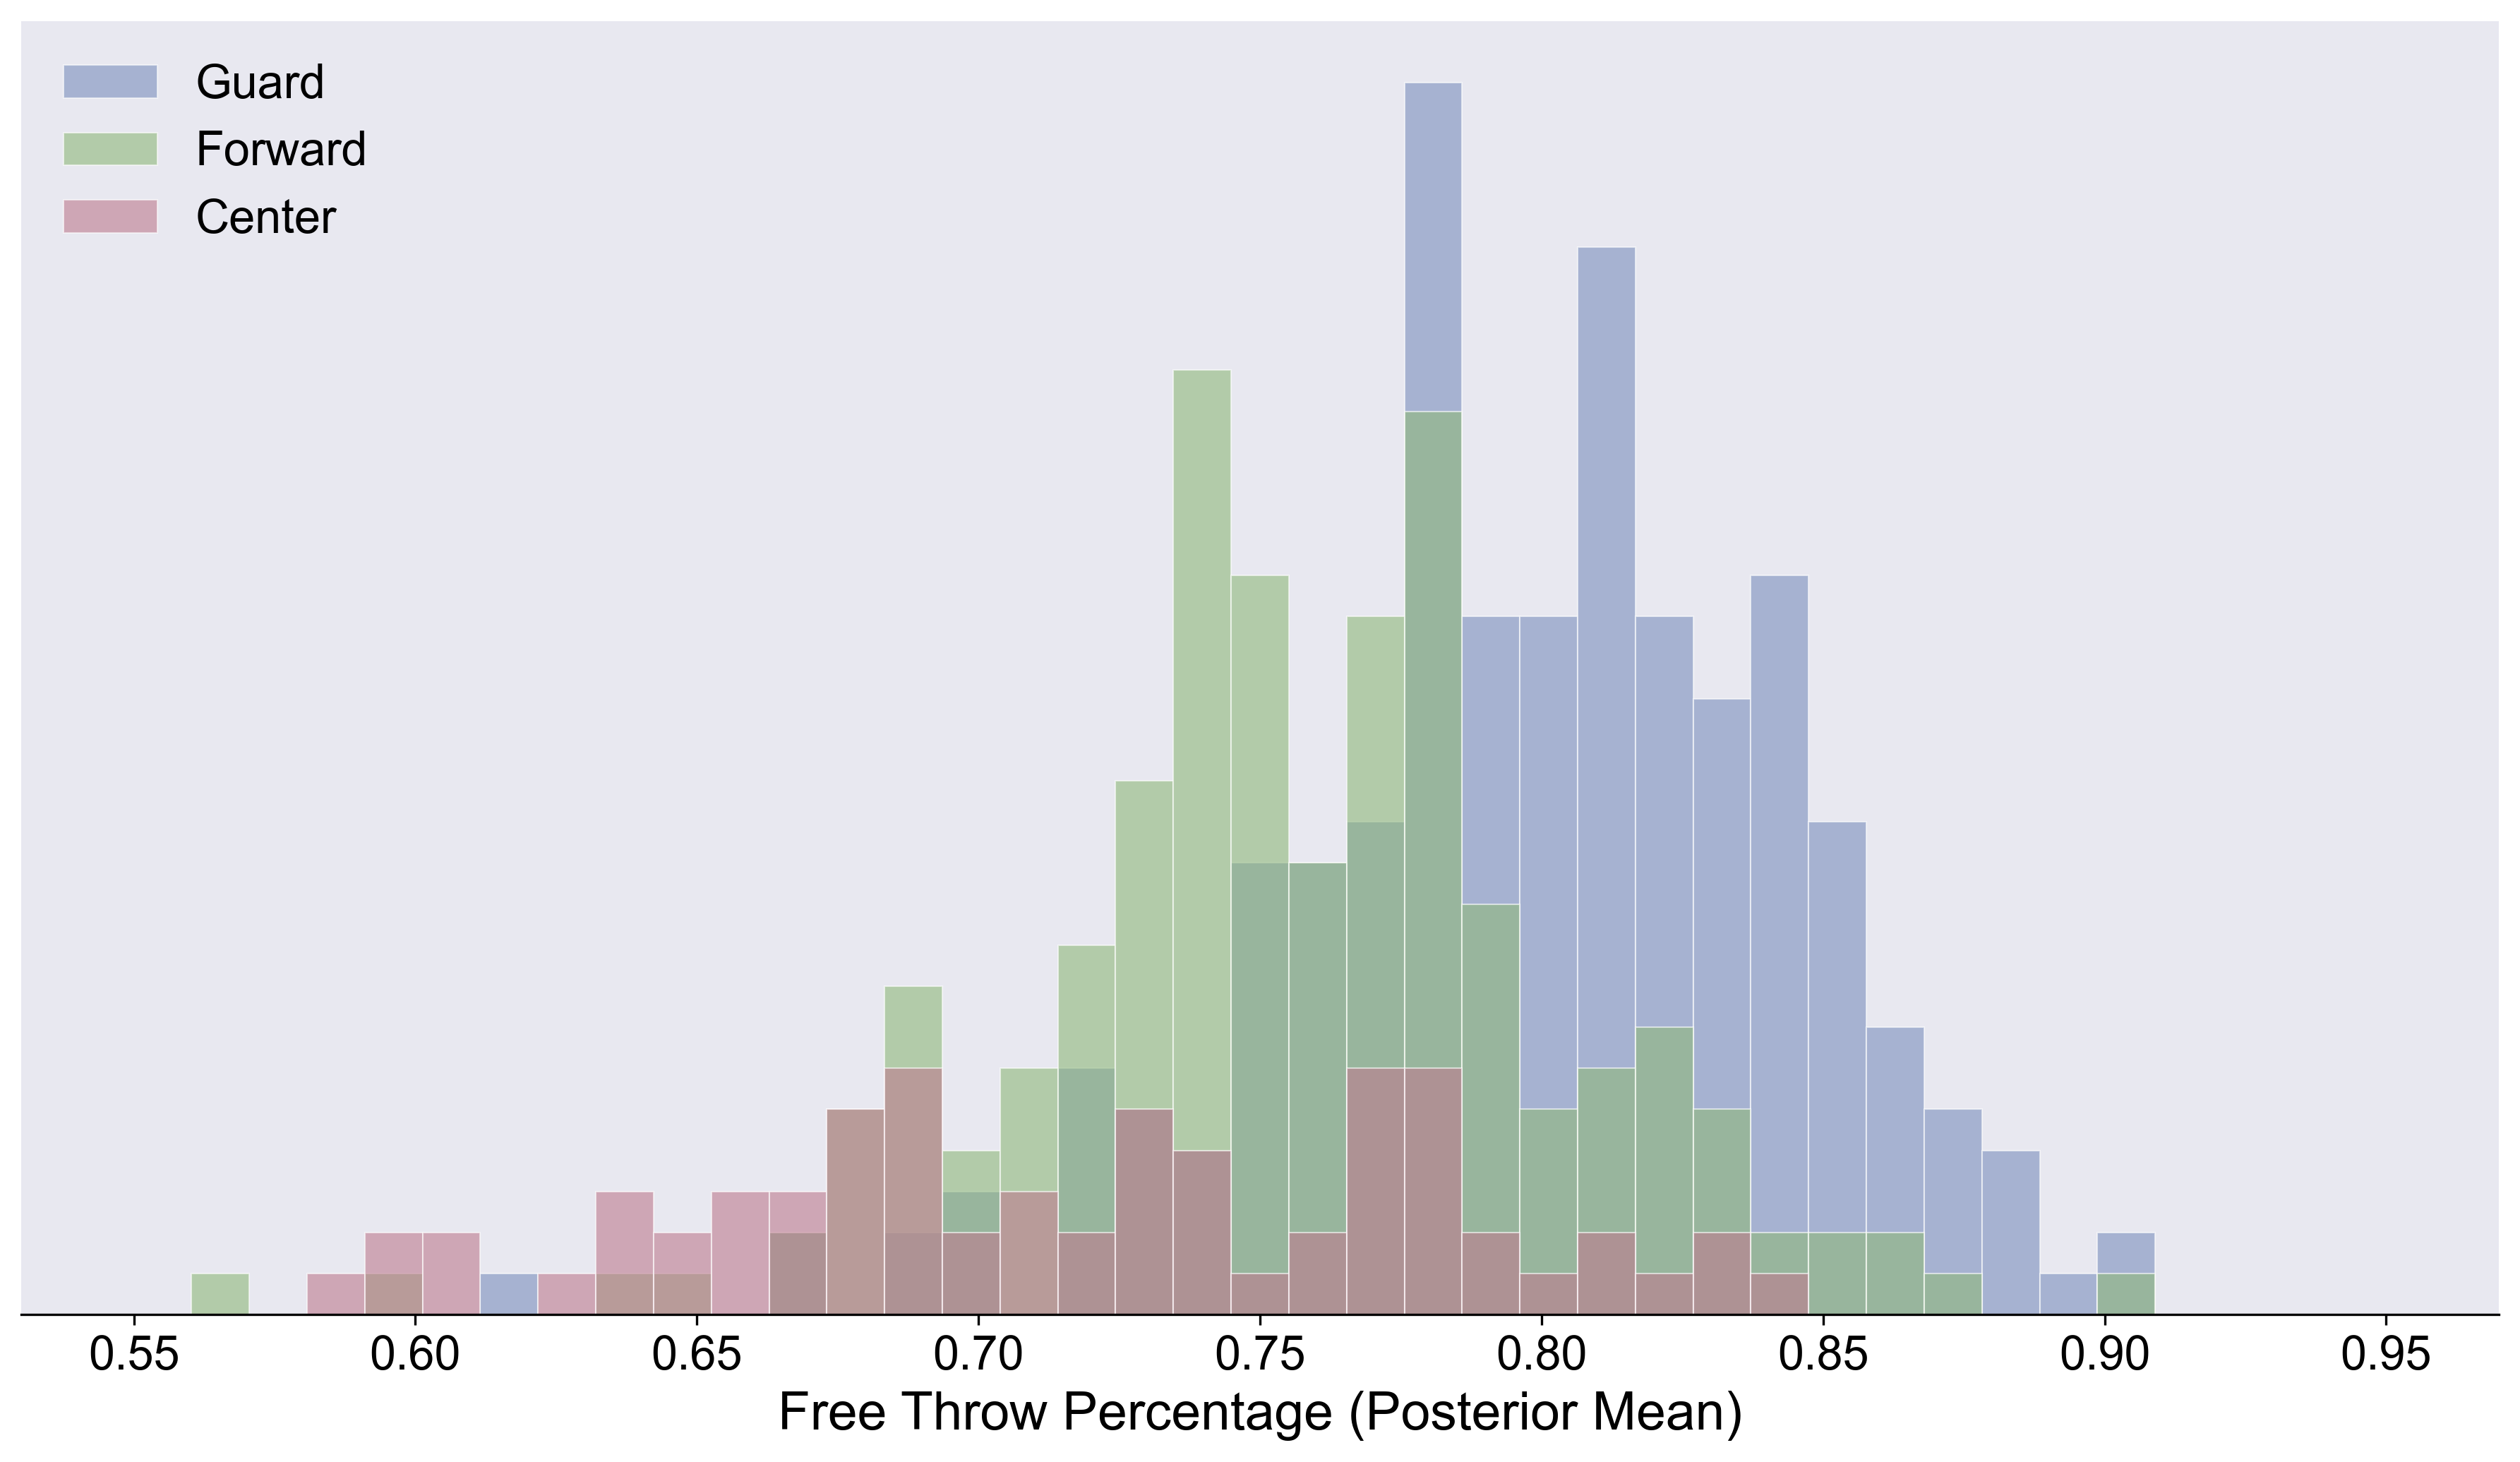
This plot shows each player’s learned posterior FT%, colored by position.
Nothing here is surprising, but it’s nice confirmation of what we expect. Importantly, the variance on centers is larger than other positions. To me, not unexpected, but the magnitude of the phenomenon is more than I would have guessed.
Best Shooters by Position
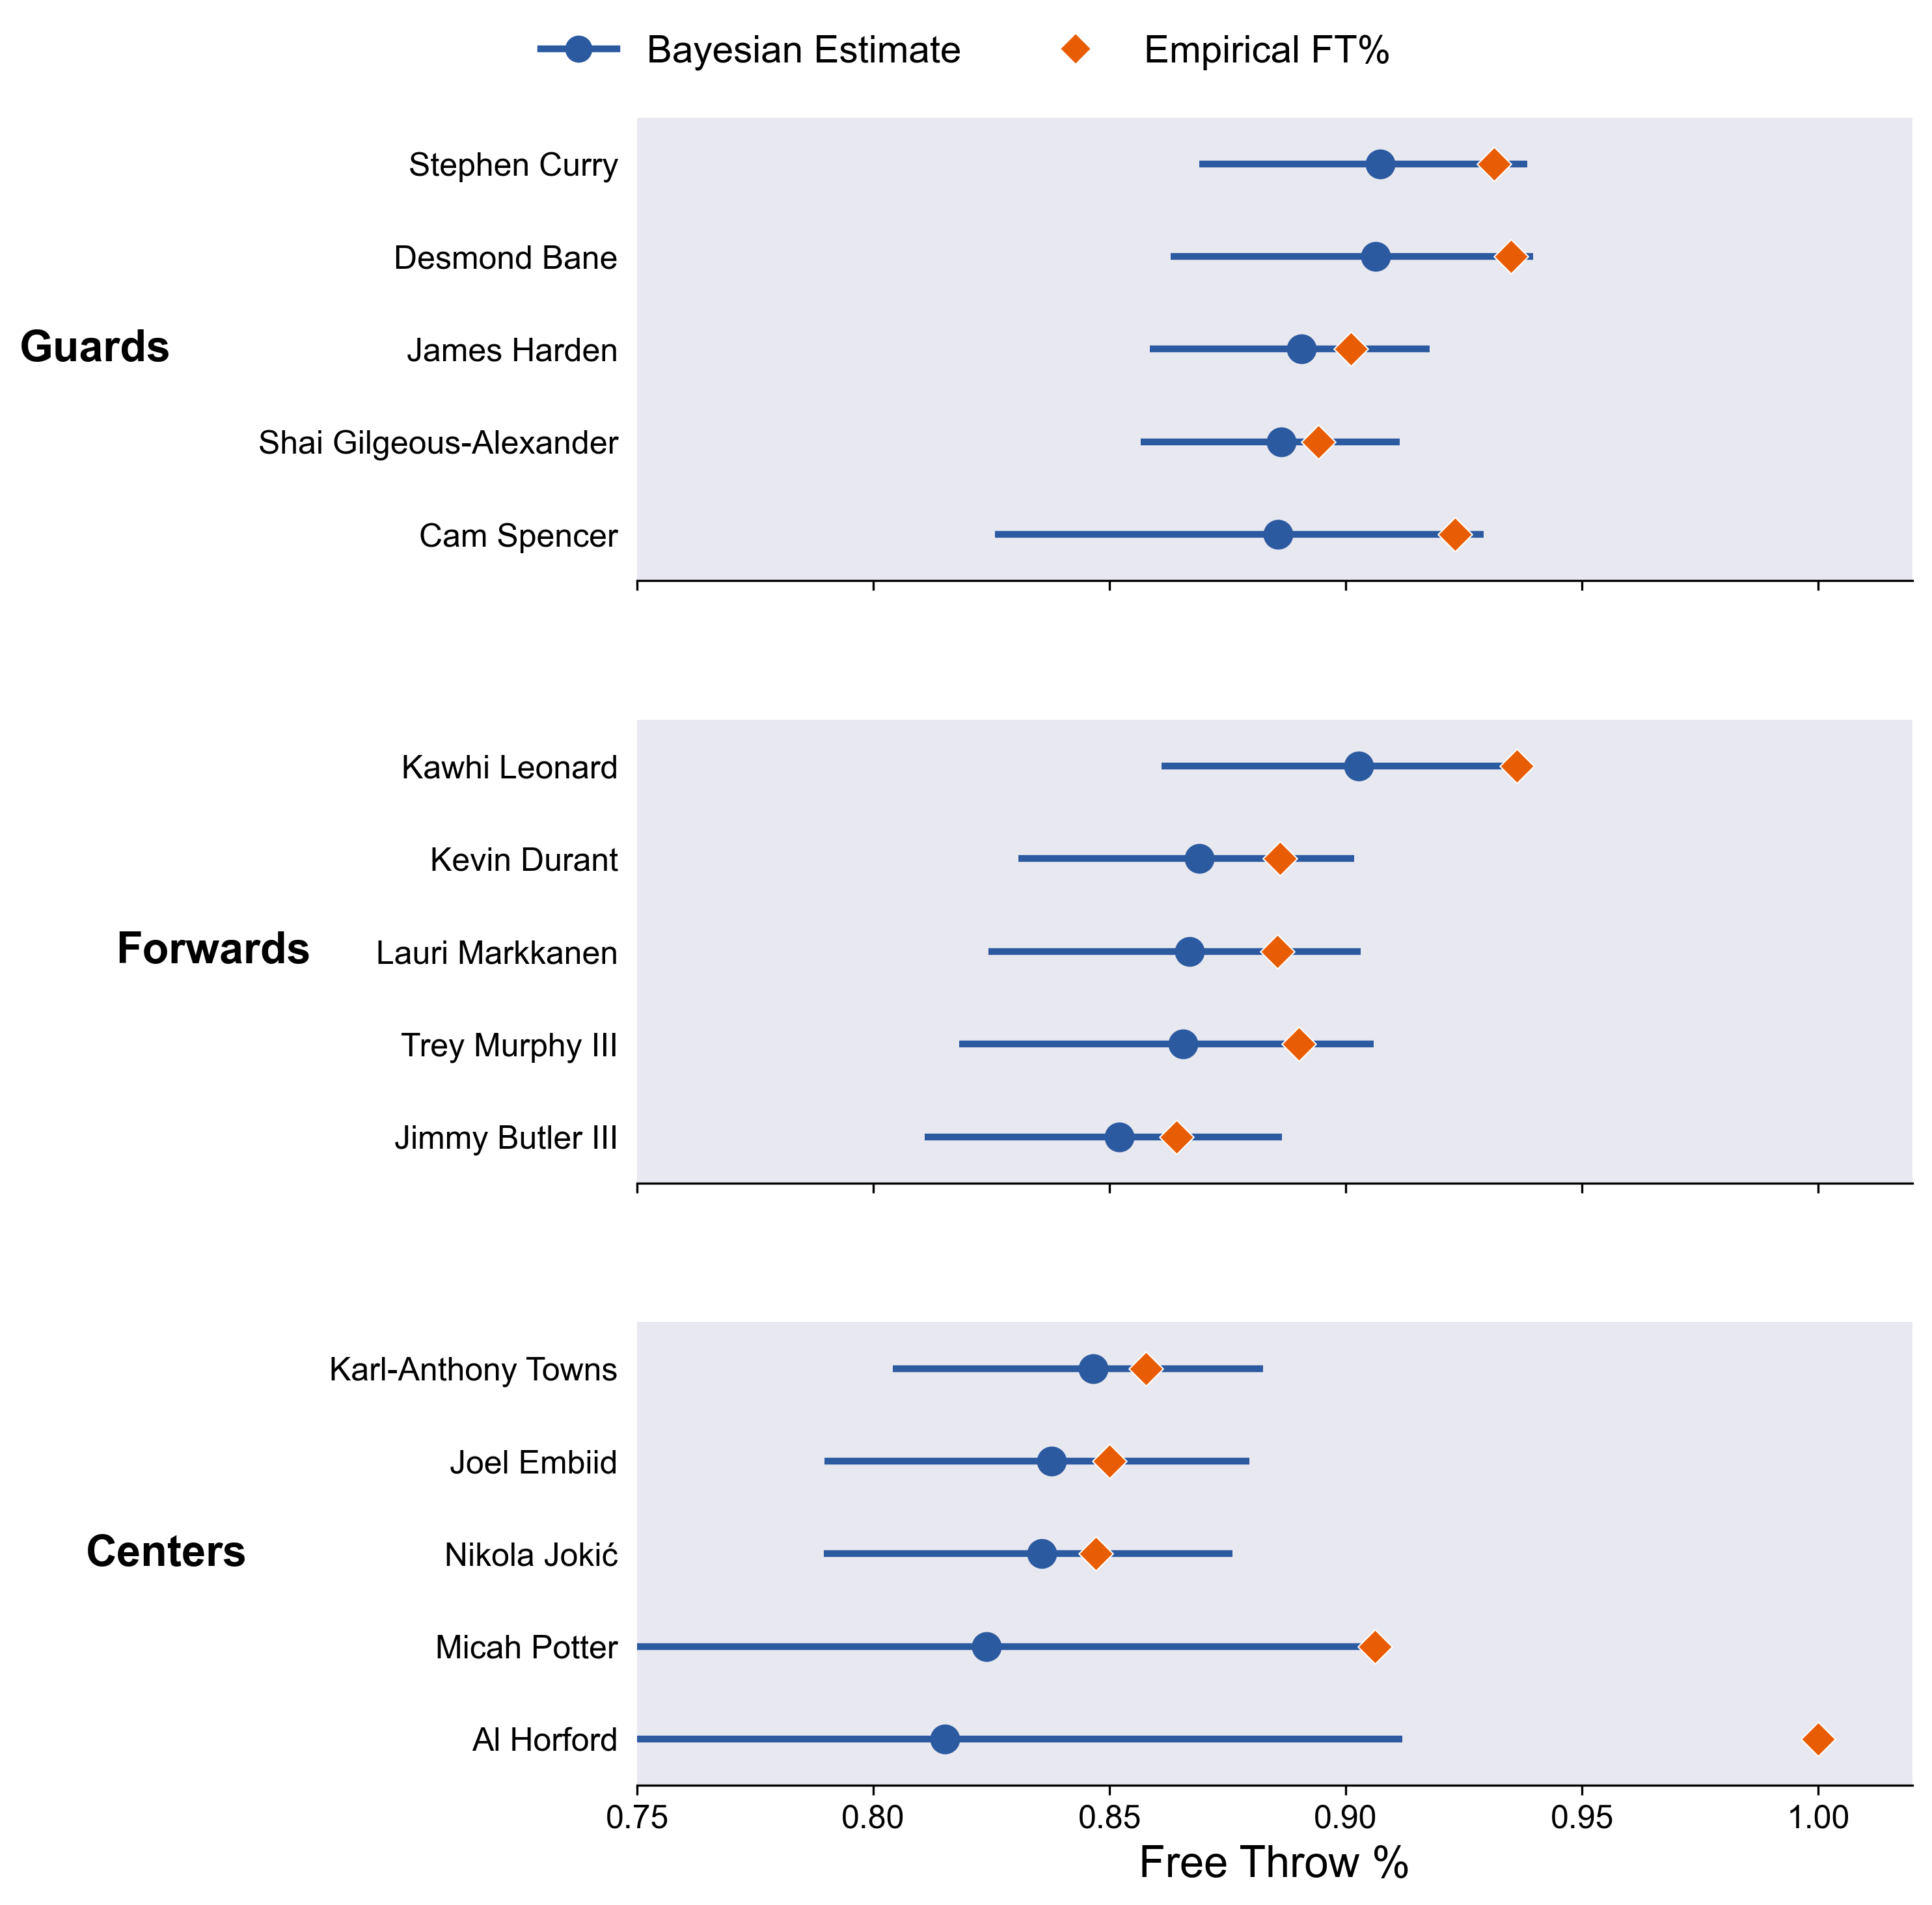
Some things to note:
It’s probably not worth it to walk through every player, but take some time to look at everyone.
I like noting when the Bayesian estimates are ranked differently than the empirical estimates. E.g. Cam Spencer. It always corresponds to a large uncertainty in the player’s Bayesian estimate.
Al Horford.
Worst Shooters by Position
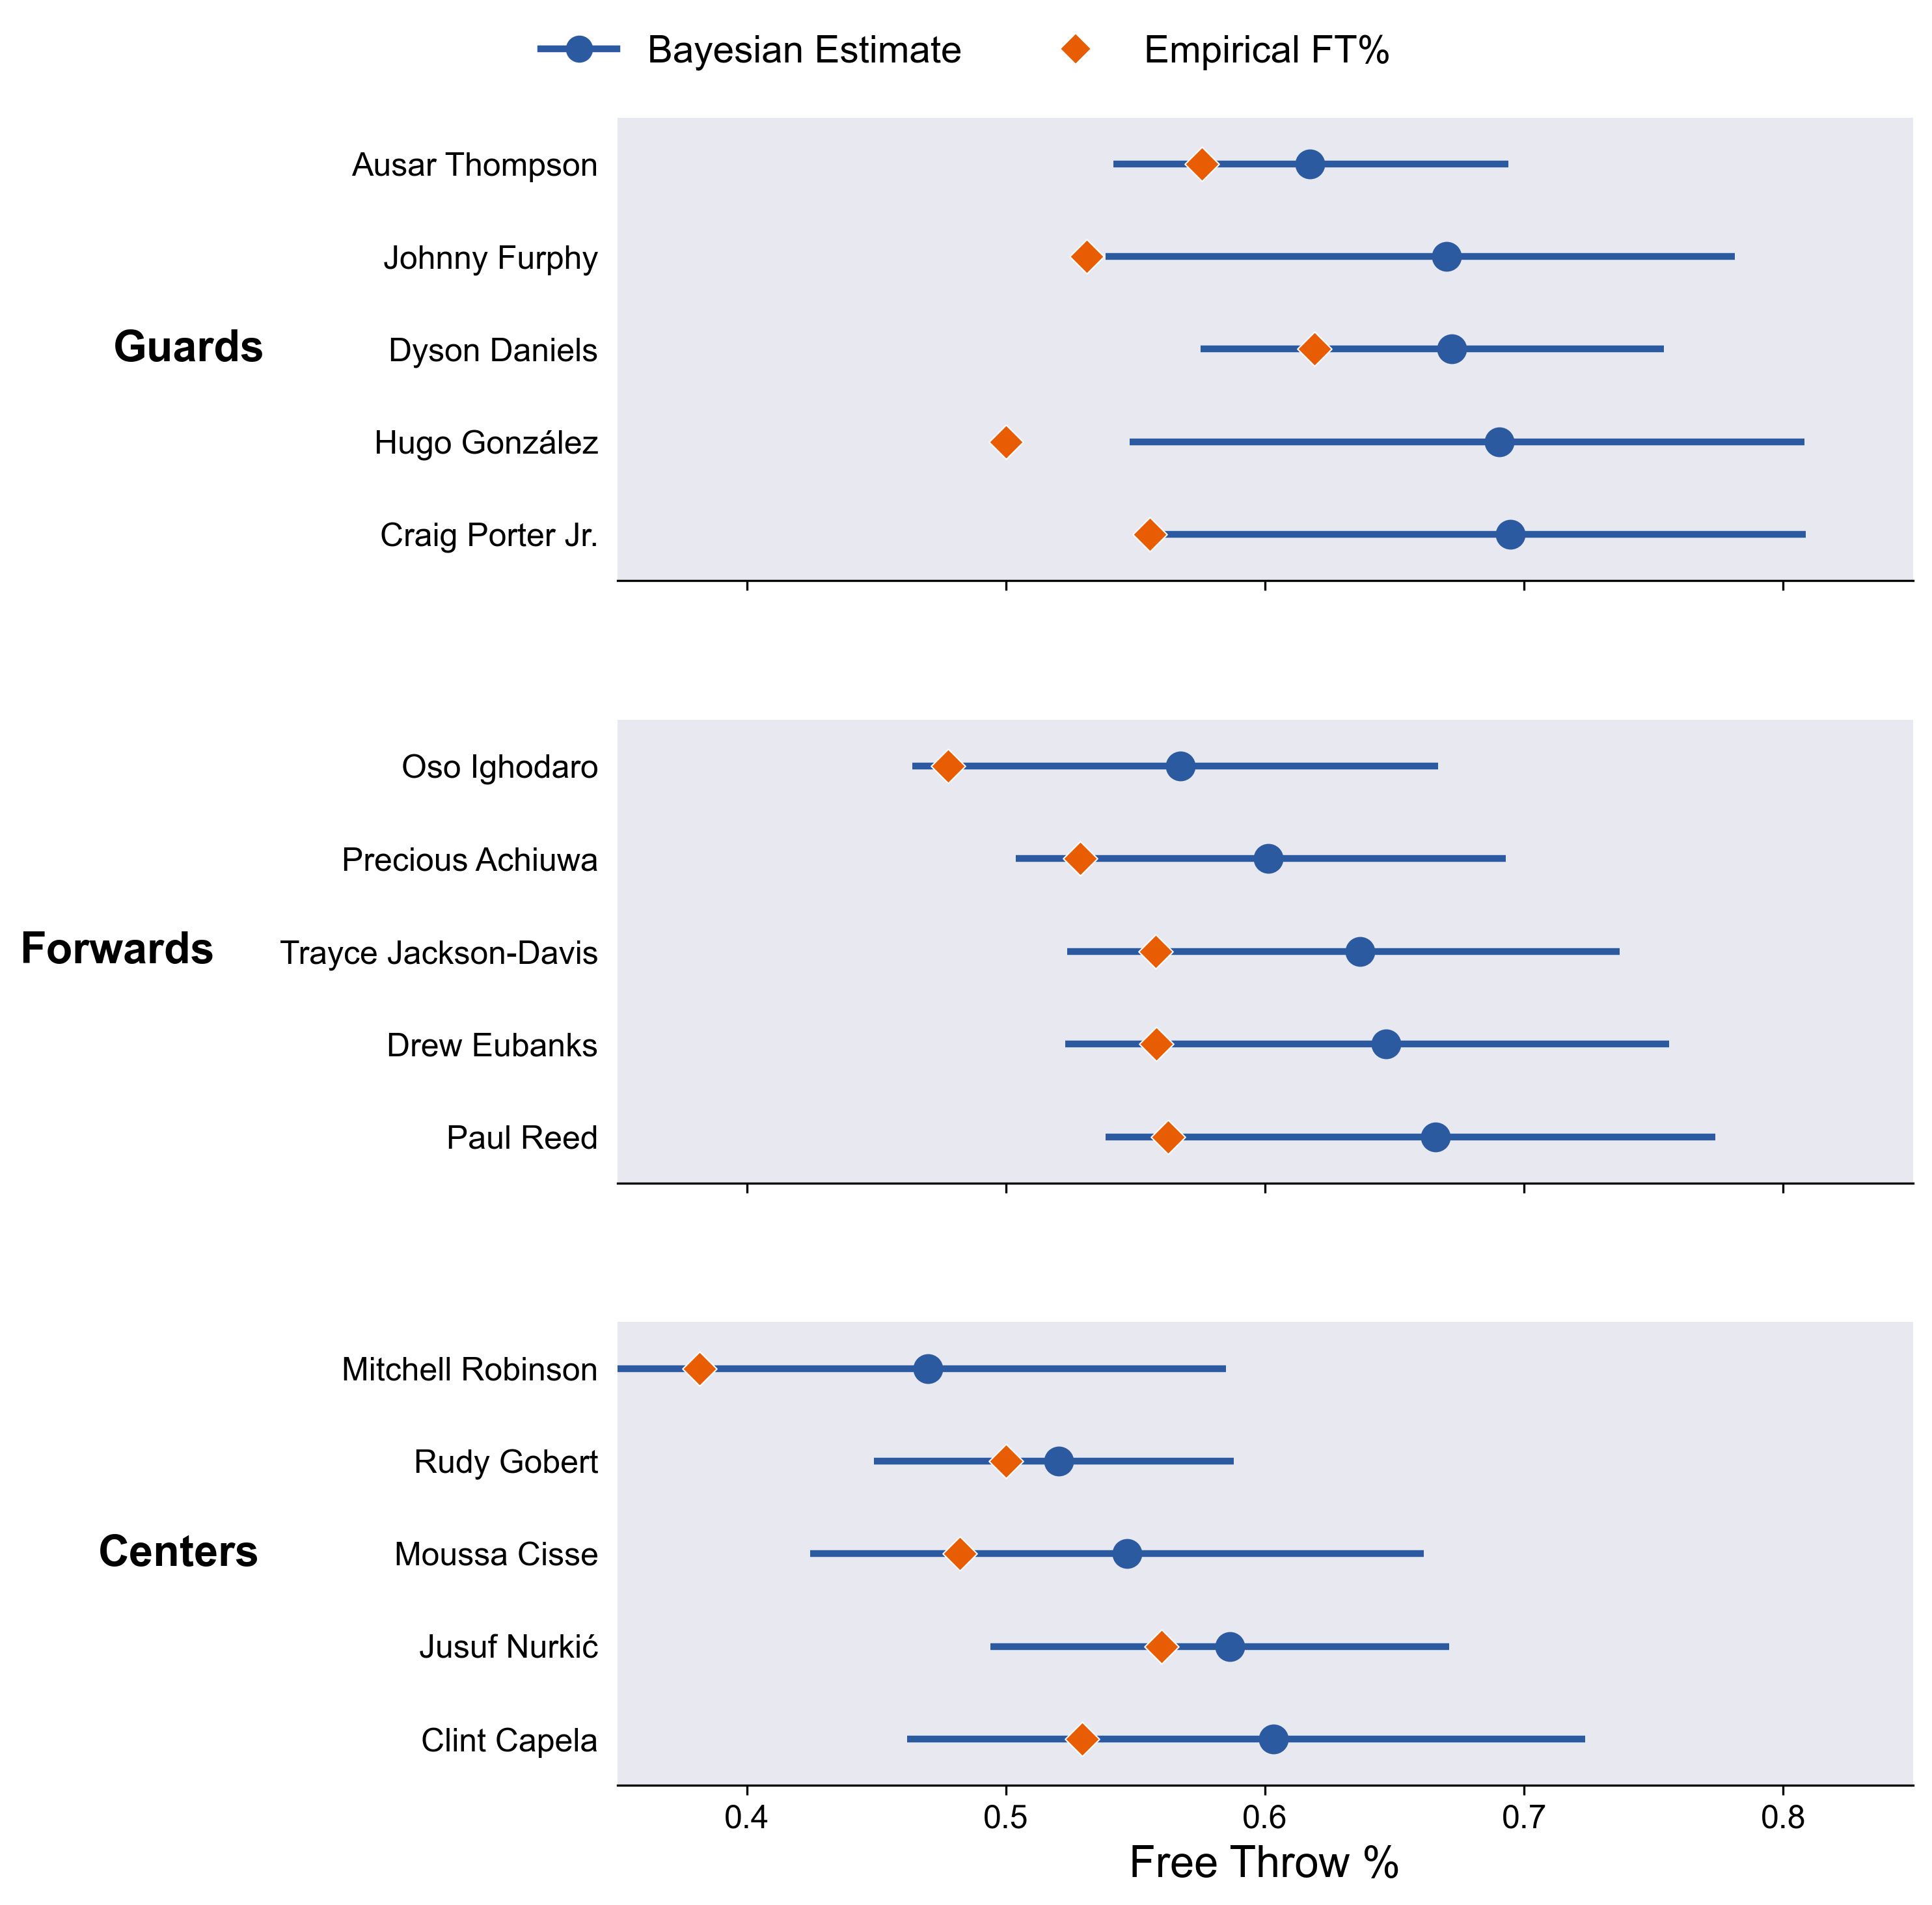
The uncertainties here are larger.
Since these are the extremes, they are almost always pulled towards their positional means.
Rudy Gobert.
Looking Ahead
I’ll probably continue to make this incrementally more complicated until I get interested in a new topic. Any ideas to make it incrementally complicated are welcome! Let me know.
Model
// Hierarchical binomial model with position-level priors
// Each position (Guard, Forward, Center) has independent mu and sigma

data {
  int<lower=0> N;                 // number of players
  int<lower=1> P;                 // number of positions (3)
  array[N] int<lower=1,upper=P> position;  // position for each player
  array[N] int<lower=0> fta;      // free throw attempts
  array[N] int<lower=0> ftm;      // free throws made
}

parameters {
  vector[P] mu;                   // position-level means (logit scale)
  vector<lower=0>[P] sigma;       // position-level sds
  vector[N] theta;                // player-specific ability (logit scale)
}

model {
  // Position-level priors (independent for each position)
  mu ~ normal(1.1, 0.5);          // ~75% FT prior on probability scale
  sigma ~ exponential(2);

  // Players drawn from their position’s distribution
  for (n in 1:N) {
    theta[n] ~ normal(mu[position[n]], sigma[position[n]]);
  }

  // Likelihood
  ftm ~ binomial_logit(fta, theta);
}

generated quantities {
  vector[N] ft_pct;
  vector[P] mu_pct;               // position means on probability scale
  ft_pct = inv_logit(theta);
  mu_pct = inv_logit(mu);
}
If the out-of-sample residuals of all of your highest-projected guys are positive and the out-of-sample residuals of all your lowest-projected guys are negative, wouldn't that imply that the prior you're using is too sticky relative to what would predict best out of sample?
I'm kind of curious if within position there is variation by height. Like are small centers better? I think we tend to over-index on Shaq, but KAT is really good at FTs (it might be the thing he's best at [shots fired]).