
Home Court Advantaged Dipped in 2021
Subtle, but real.

In 2021, Mark Stein comments on twitter:
How much was home court advantage actually down in 2021? Not much, but the dip was real.
Looking at home court advantage since 2012, indeed 2021 was the lowest:

But even from this, you can see the uncertainty in home court advantage is wide. Home court advantage is consistently about 2.5 points, but it might be anywhere from 2 to 3 points.
Focusing in on 2021 and comparing it to the last non-bubble season, 2019, it’s clear that there was a real dip in home court advantage that wasn’t just noise.
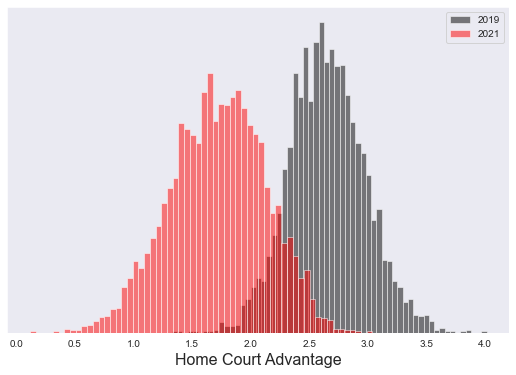
There’s a lot of uncertainty in the 2021 season’s home court advantage strength; it could have been anywhere from 0.5 to 2.5. But regardless what that true value is, Mark Stein’s tweet wasn’t wrong.
Stan Model
You can stop reading. This section is only for people curious about the underlying probability model. Either because they want to understand the details or they want to expand on it themselves. Here's my Stan model.
This is a fairly straightforward model where home team advantage for each year is hierarchically modeled.
// Model the yearly free throw rates over the last five years

data {
    int<lower=0> n_years;
    int<lower=0> n_games;
    int year[n_games];
    vector[n_games] score_differential;

}
parameters {
    vector[n_years] theta;
    real<lower=0> sigma;
    real theta_bar;
    real<lower=0> sigma_bar;
}


model {
    theta_bar ~ normal(0, 10);
    sigma_bar ~ cauchy(0, 5);
    theta ~ normal(theta_bar, sigma_bar);
    sigma ~ cauchy(0, 5);
    for(game in 1:n_games) {
        score_differential[game] ~ normal(theta[year[game]], sigma);
    }
}