
Is Free Throw Percentage down in the NBA This Season?
Only slightly, but yes.

Free Throw Percentage is down from 78% to 77% this year. That's a tiny difference and this season is just getting started. So is it down by chance or is it actually down? If after the first day this season the free throw percentage was 50%, we probably wouldn't have enough data to know if free throw shooting was down this season.
Extending on the binomial model from last time, I've used a slightly more complicated model that takes into account differences across years.
Here is the model's estimates for Free Throw Percentage each year since 2021:
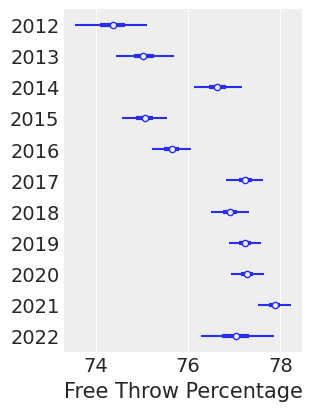
Interestingly, it looks like free throw percentage has slowly been creeping up since 2012, with last season being the high water mark.
So, is free throw shooting actually down this year? This is what the model thinks this year's percentage is compared to last year:
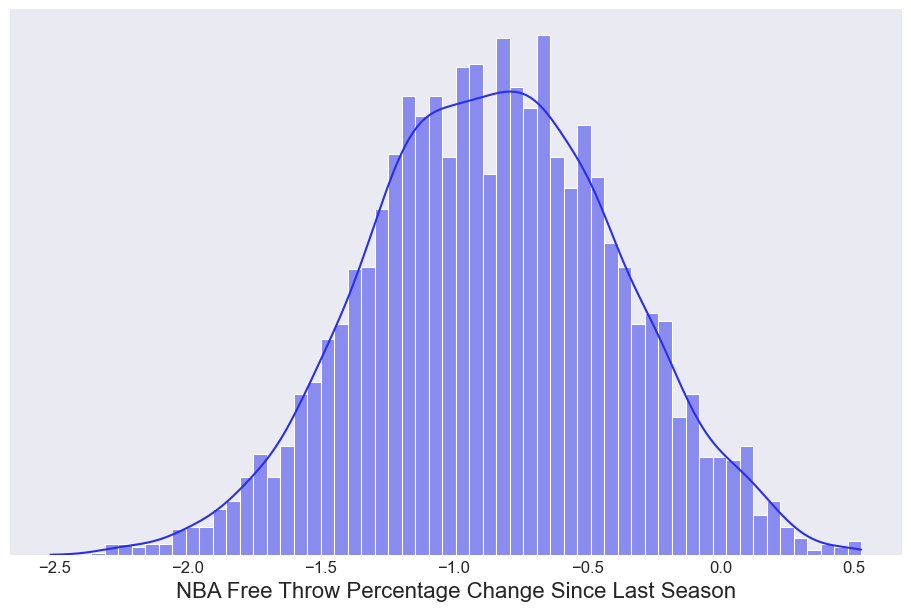
The model is fairly uncertain about the actual difference between this season and last, but it’s most likely down one percentage point. Also, there's very little chance this season's free throw percentage is as good as last year's.
Stan Model
You can stop reading. This section is only for people curious about the underlying probability model. Either because they want to understand the details or they want to expand on it themselves. Here's my Stan model.
The main extension in this post is the heirarchical model which learns variation between years.
// Model the yearly free throw rates over the last five years

data {
    int<lower=0> years;
    int<lower=0>n_attempts[years];
    int<lower=0>n_successes[years];

}
parameters {
    vector<lower=0, upper=1>[years] theta;
    real<lower=0, upper=1> theta_bar;
    real<lower=0> sigma_bar;
}


model {
    theta_bar ~ normal(1, 10);
    sigma_bar ~cauchy(0, 5);
    theta ~ normal(theta_bar, sigma_bar);
    for(year in 1:years) {
        n_successes[year] ~ binomial(n_attempts[year], theta[year]);
    }
}

generated quantities {
    // Is this year different than last year?
   real this_year_diff;
   this_year_diff = theta[years] - theta[years -1];
}