
Predicting Basketball Winners After Watching the First Half
If you were trying to predict the winner of an NBA game, would you rather know the score at halftime, or which teams are playing?

How likely is a comeback by a stronger team? What about a weaker team? Can a weaker team hold their halftime lead? These are all questions we’re trying to address in this post’s model.
Or, more concretely: How likely are the Knicks to win against the 76ers when they are up by 5 at halftime?
Specifically, we built a fully Bayesian hierarchical model that incorporates team offensive strength, team defensive strength, and the halftime score to predict the final winner in an NBA game.
As always, the full model is at the bottom of the post, but put simply: this is an extension of our previous game prediction model. It adds a second component to the likelihood that uses the halftime score to predict the final winner.
Win probabilities for equal-strength teams
What if two perfectly matched strength teams are playing? Since we have a fully Bayesian model, we can look not only at point estimates but the entire distribution of probabilities learned by the model.

Seen above, the home team has between a 0.2 and 0.8 probability of winning (when playing an equal strength opponent), depending on what the halftime score is. Personally, one point at halftime had a larger effect than I was expecting.
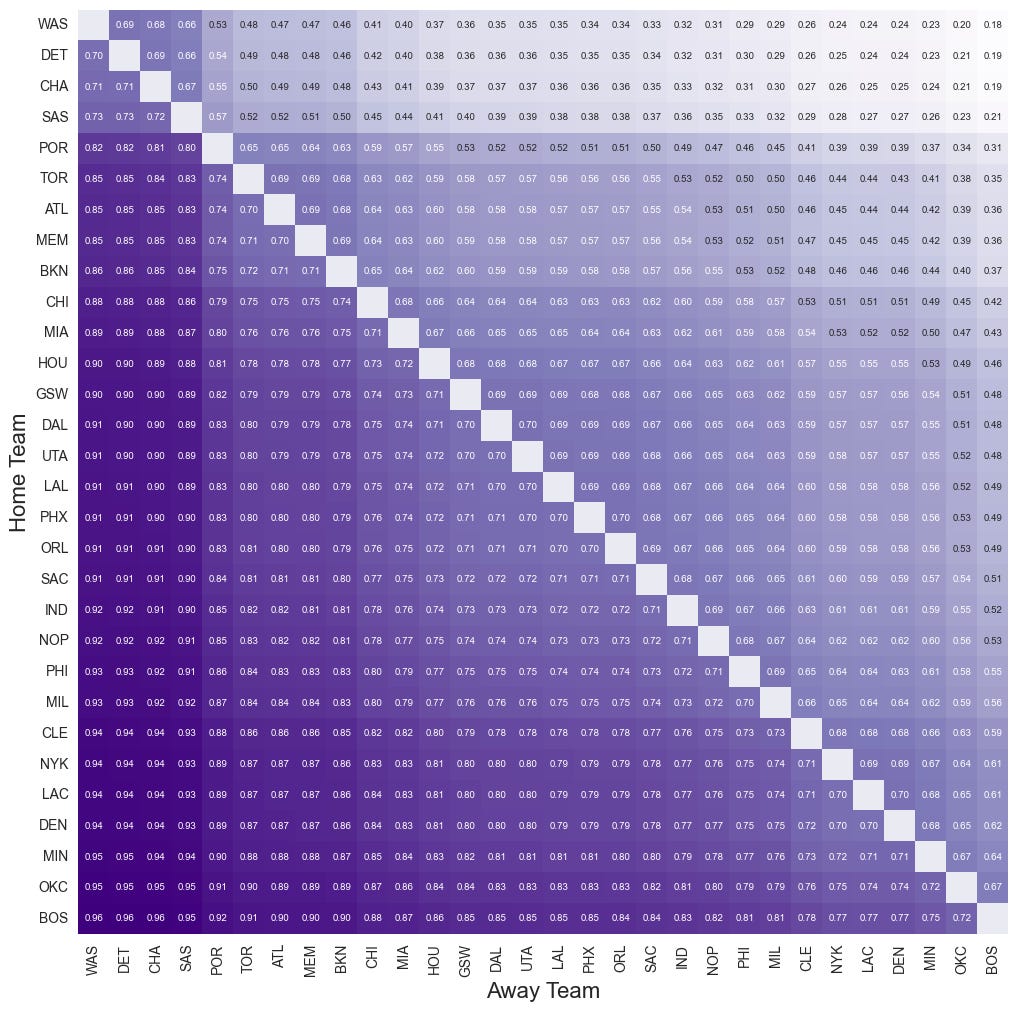
Team-vs-team match-ups at different halftime scores.
We can also look at the probability that each home team is to win against their opponent for any halftime score. First, starting with a tied halftime score:

But we can also adjust the halftime score and see how the win probabilities change. Here’s what happens when the home team is winning by 5 at halftime:
Any home team, any away team, any halftime score
We can query the model for any combination of teams and halftime score. We’ll get the point estimate but also the measure of our uncertainty in the prediction.
Going back to our original example: How likely are the Knicks to win against the 76ers when they are up by 5 at halftime? Here, we’re plotting their win probability distribution when they are tied at halftime and when they are winning by 5 at halftime:

The model
// Hierarchical IRT regression
//
// This models the points of home and away teams
// as a function of the latent offensive and defensive
// strength of the teams.
//
// Specifically, this version tries to predict the game winner
// given the first half score.

data {
    // Number of games
    int<lower=1> N_games;

    // Number of teams in the league
    int<lower=1> N_teams;

    // Home and away points scored in each half
    array[N_games] int<lower=0> home_points_h1;
    array[N_games] int<lower=0> away_points_h1;
    array[N_games] int<lower=0> home_points;
    array[N_games] int<lower=0> away_points;

    // Team index for each game
    array[N_games] int<lower=1, upper=N_teams> home_team;
    array[N_games] int<lower=1, upper=N_teams> away_team;

    // Indicator variable for home team winning
    array[N_games] int<lower=0, upper=1> home_win;

    // First Half Difference in points
    array[N_games] int first_half_diff;
}

transformed data {
    // Section 3.3.1 https://betanalpha.github.io/assets/case_studies/prior_modeling.html
    // Threshold for home field advantage
    // 99% of the density should be between 0 and this value
    real home_field_advantage_threshold = 5;
    real home_field_advantage_prior_sigma = home_field_advantage_threshold / 2.57;
}

parameters {
    // Latent offensive and defensive strength of each team
    // Hierarchical prior
    vector[N_teams] theta_offense;
    vector[N_teams] theta_defense;
    real theta_offense_bar;
    real theta_defense_bar;
    real<lower=0> sigma_offense_bar;
    real<lower=0> sigma_defense_bar;

    // Noise in the points (same for home and away teams)
    real<lower=0> sigma_points;

    // Home field advantage is extremely unlikely to be negative
    real <lower=0> home_field_advantage;

    // Home field advantage of home team winning
    real home_field_advantage_classification;

    // Impact of first half score on final score
    real theta_first_half;

    // Impact of team strength on home team winning
    real theta_team_strengths;
}

model {

    // Prior Modelinng

    // Average strength of the teams
    theta_offense_bar ~ normal(110, 6.67);

    // Home field advantage
    // Put 99% of dennsity between 0 and input {home_field_advantage_threshold}
    home_field_advantage ~ normal(0, home_field_advantage_prior_sigma);
    home_field_advantage_classification ~ normal(0, home_field_advantage_prior_sigma);

    // Variations of the teams strength
    sigma_offense_bar ~ normal(0, 12);
    sigma_defense_bar ~ normal(0, 12);

    // Individual team strength
    theta_offense ~ normal(theta_offense_bar, sigma_offense_bar);
    theta_defense ~ normal(0, sigma_defense_bar);

    // Gaussian noise in the points
    sigma_points ~ normal(0, 7);

    // Imact of first half score on home team winning
    theta_first_half ~ normal(0, 3);

    // Impact of team strength on home team winning
    theta_team_strengths ~ normal(0, 10);

    // Likelihood
    for(game in 1:N_games) {
        // Team points modeled as gaussian
        real home_points_regression = home_field_advantage +
                                      theta_offense[home_team[game]] +
                                      theta_defense[away_team[game]];
        real away_points_regression = theta_offense[away_team[game]] +
                                      theta_defense[home_team[game]];
        home_points[game] ~ normal(home_points_regression, sigma_points);
        away_points[game] ~ normal(away_points_regression, sigma_points);

        // Probability home team wins
        real home_win_regression = home_field_advantage_classification +
                                   theta_team_strengths * (theta_offense[home_team[game]] +
                                                           theta_defense[away_team[game]] -
                                                           theta_offense[away_team[game]] -
                                                           theta_defense[home_team[game]]) +
                                   theta_first_half * first_half_diff[game];
        home_win[game] ~ bernoulli_logit(home_win_regression);

    }
}

generated quantities {

    // Remove the mean from the latent variables
    vector[N_teams] theta_defense_centered;

    for (i in 1:N_teams) {
        theta_defense_centered[i] = theta_defense[i] - mean(theta_defense);
    }

    vector[N_teams] theta_offense_centered;

    for (i in 1:N_teams) {
        theta_offense_centered[i] = theta_offense[i] - mean(theta_offense);
    }
}
I'd be interested to know how much of this depends on coaches that rest their stars at half time when winning. Built into the team effects must be this strategic response.