
Probability of NBA overtime over the years
What's the chance tonight's game goes into overtime?

Having taken a long hiatus, we thought to come back with a mundane question and simple models. Understanding whether or not a game goes into overtime has implications for league parity, corruption, and long-shot over bets.
Comparing this season to the last 24 years
What’s the probability that a random game from the last 24 seasons goes into overtime? Answer that question in your head and see how close you are.
One way to answer the question is calculate the fraction of games that have gone into overtime. But this is binomial basketball, so we fit a Bayesian binomial model and looked at the distribution of the rate parameter to get a sense not only of the probability, but our uncertainty in that estimate. As usual, all Stan models are at the end of the post.

There’s about a 5.9% chance that a random game in the last 24 years went into overtime. And there’s just so much data that there’s not much uncertainty. Probably somewhere between 5.6% and 6.1%.
But what about just this season? What if you wanted to estimate the chance that a random game coming up will go into overtime?

Two things to note:
This season looks less likely to go into overtime compared to a random game from the last 24 seasons. Around a 4.4% chance this season, compared to 5.9%
This season’s estimate has much less certainty. The estimate is probabilty somewhere between 3.5% and 5.5%. This makes sense, considering we have a lot less data when we look at just this season.
Hierarchical Binomial Model
There really hasn’t been much overtime this season to learn from. Using a hierarchical model, we can leverage information from other seasons to get a more accurate estimate of this season’s overtime probability.
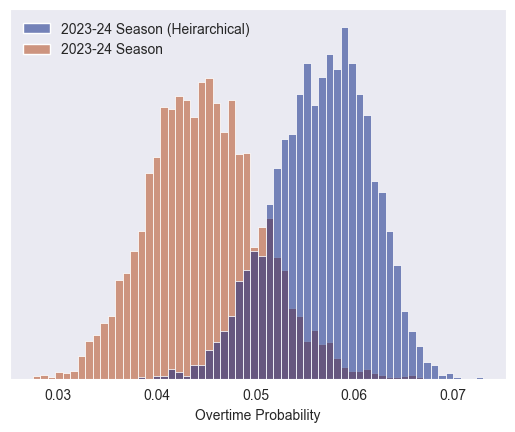
Our hierarchical model puts a higher probability on a game this season going into overtime. Essentially, the model is saying: this season looks like an outlier so far and there’s not much data to go on, so probably the overtime probability is a touch higher than what we’ve seen so far.
And since we have the fully Bayesian hierarchical model, we can look at overtime probability over the years (overtime over time, if you will).

The obvious thing to notice is that since 2000, overtime probability has been trending downward, almost linearly. An obvious next step would be to regress on years within our hierarchical model.
Two questions for you:
Why do you think overtime probability is decreasing?
What was your a priori guess for the probability a game went into overtime?
Looking ahead
I basically just pulled up my old code, scraped some data and got the Stan engine greased up again. The content of this post was not very interesting, but I’m thinking about getting into the groove again.
I’m going to move to the other side of Brooklyn soon.
Models
Simple Binomial Model
# Simple Binomial Model

data {
  // Number of Games
  int<lower=1> N_games;

  // Binary, overtime or not
  int<lower=0, upper=N_games> N_overtimes;
}

parameters {
    // Single binomial parameter
    real theta;
}

model {
    // Weak, uninformative prior
    theta ~ normal(-1, 10);

    // Number of overtimes is modeled binomial
    N_overtimes ~ binomial_logit(N_games, theta);
}

generated quantities {
    // Transform theta back to probability
    real theta_probability;
    theta_probability = inv_logit(theta);
}
Hierarchical Seasonal Binomial Model
# Hierarchical Binomial Regression

data {
  int<lower=1> N_seasons;
  int<lower=0> season_games[N_seasons];
  int<lower=0> season_overtimes[N_seasons];
}

parameters {
    vector[N_seasons] theta;
    real theta_bar;
    real<lower=0> sigma_bar;
}

model {
    theta_bar ~ normal(-1, 10);
    sigma_bar ~cauchy(0, 5);
    theta ~ normal(theta_bar, sigma_bar);
    for(season in 1:N_seasons) {
        season_overtimes[season] ~ binomial_logit(season_games[season], theta[season]);
    }
}
Welcome back! Glad to have this show up just as I was checking my email. I would be curious how scoring or point differential affects the probabilities for OT.