
Modeling Player Decline Throughout Games
Predicting which players are going to struggle late in games.

Some players get better as a 48-minute game goes on. Some players get worse. We developed a model that predicts performance through each quarter of the game (see full model below) to identify players that improve or decline as the game progresses.
The model doesn’t simply look at performance in each quarter, but can naturally distinguish between performance differences that arise due to chance and differences that have enough data to be real. And as always, we are most interested in understanding how confident our model is, so every prediction comes with confidence intervals.
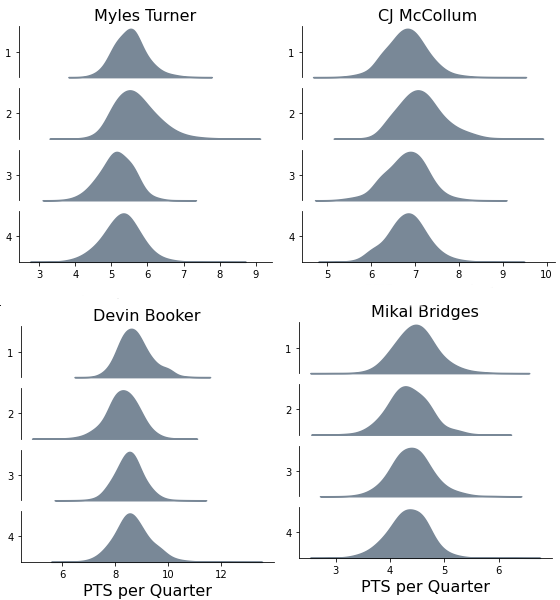
As it turns out, most players in the league are very consistent as the game progresses. Our model predicts every stat, but here’s how many points our model predicts a few consistent players would score in each quarter if they played all twelve minutes.
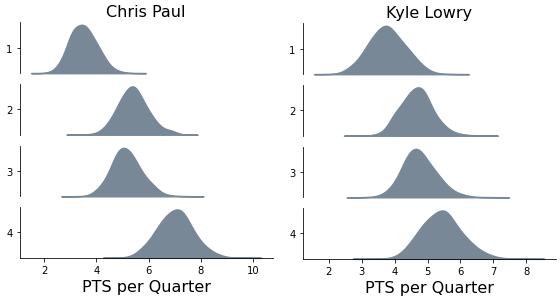
Looking through all the player’s predictions, Kyle Lowry stands out as a player who improves as the game progresses, but Chris Paul is the most striking. He goes from a predicted 2 PTS in the first quarter to 7 PTS in the 4th quarter. His dramatic difference can be explained both by increased usage and efficiency. For example, he takes 50% more 3PT attempts in the 4th quarter relative to the first quarter (and makes them at a higher rate).
Here are some examples where the model is fairly certain the player drops in performance later in the game. Domantas Sabonis drops from about 7 PTS per quarter in the first half to 5PTS per quarter in the second half. Similarly, Justin Holiday seems to have a steep drop off in the final quarter of the game.
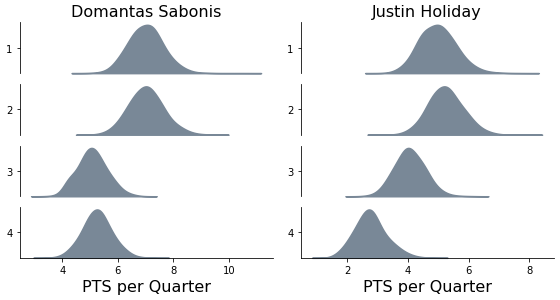
PTS per quarter could drop off due to lower usage or less efficiency. Sabonis is less efficient: dropping from 65% FG shooting in the first half of the game to 50% in the second half. Justin Holiday drops from 36% 3PT shooting in the first quarter to 26% in the 4th quarter. It’s worth noting the model is identifying these drops as actual differences in player performance, not due to chance.
So why is their performance dropping? It could be fatigue. Let me know what you attribute it to.
An Anecdote about James Harden
Speaking of player fatigue…
Years ago, I did a lot of modeling of player tracking data. It didn’t matter how I sliced the data it always told the same story about James Harden: he was incredibly out of shape. I wrote it up and called it day. Then a few months later I had an interview with Daryl Morey and Monte McNair. I was excited to show them the work I had done modeling player fatigue and James Harden but wasn’t sure if it was a good look to go in there with all this data showing something that was probably a sore subject for them.
I ended up deleting all the James Harden data from my analysis before the interview.
Stan Model
You can stop reading. This section is only for people curious about the underlying probability model. Either because they want to understand the details or they want to expand on it themselves.
This model is beast. It has 2,486 parameters, is doubly nested, and takes 2 hours to fit. While I’m very interested in how player performance evolves over time, I’m thinking I want to refactor this whole model before moving forward.
data {
    int<lower=0> n_players;
    int<lower=0> n_stats;
    int stats[n_stats];
    int stats_quarter[n_stats];
    int stats_player_index[n_stats];
    vector[n_stats] minutes;
}

parameters {
   vector[n_players] player_value_bar;
   vector<lower=0>[n_players] player_value_sigma;
   real theta_bar;
   real<lower=0> sigma_bar;
   matrix[n_players, 4] player_quarter_value;
}

model {
    // Hierarchical Prior on player's average parameter
    theta_bar ~ normal(0, 10);
    sigma_bar ~ cauchy(0, 5);
    player_value_bar ~ normal(theta_bar, sigma_bar);

    // Hierachical prior on player's quarterly parameter
    player_value_sigma ~ cauchy(0, .5);
    for (player in 1:n_players) {
        player_quarter_value[player] ~ normal(player_value_bar[player], player_value_sigma[player]);
    }

    // Poisson Regression
    for (stat in 1:n_stats) {
      stats[stat] ~ poisson(exp(log(minutes[stat]) +
                                player_quarter_value[stats_player_index[stat],
                                                     stats_quarter[stat]])) ;
  }
}
Awesome work! I’m curious why a poisson is used here instead of a negative binomial? I’d love to see an article on your points model if you ever get a chance.
I really would like to know what Morey would say about Harden. Like, 'yeah...we know.'